A Comparison of SOGR & VSRS Ratings

Earlier posts on the Very Simple Rating System (VSRS) and Set of Games Ratings (SOGR) included a range of attractive graphs depicting team performance within and across seasons.

But, I wondered: how do the two Systems compare in terms of the team ratings they provide and the accuracy with which game outcomes can be modelled using them, and what do any differences suggest about changes in team performance within and across seasons?

Read More

The Dynamics of ChiPS Ratings: 2000 to 2013

Visitors to the MatterOfStats site in 2014 will be reading about ChiPS team Ratings and the new Margin Predictor and Probability Predictor that are based on them, which I introduced in this previous blog. I'll not be abandoning my other team Ratings System, MARS, since its Ratings have proven to be so statistically valuable over the years as inputs to Fund algorithms and various Predictors, but I will be comparing and contrasting the MARS and the ChiPS Ratings at various times during the season.

Read More

Introducing ChiPS

In years past, the MAFL Fund, Tipping and Prediction algorithms have undergone significant revision during the off-season, partly in reaction to their poor performances but partly also because of my fascination - some might call it obsession - with the empirical testing of new-to-me analytic and modelling techniques. Whilst that's been enjoyable for me, I imagine that it's made MAFL frustrating and difficult to follow at times.

Read More

The Relative Importance of Class and Form in AFL

Today's blog is motivated by a number of things, the first of which is alluded to in the title: the quantitative exploration of the contributions that teams' underlying class or skill plays in their success in a given game relative to their more recent, more ephemeral form. Is, for example, a top-rated team that's been a little out of form recently more or less likely to beat a less-credentialled team that's been in exceptional form?
Read More

Are the Victory Margins for Some Games Harder to Predict than for Others?

It's unarguable that the winner of some games will be harder to predict than the winner of others. When genuine equal-favourites meet, for example, you've only a 50:50 chance of picking the winner, but you can give yourself a 90% chances of being right when a team with a 90% probability of victory meets a team with only a 10% chance. The nearer to equal-favouritism the two teams are, the more difficult the winner is to predict, and the further away we are from this situation the easier the game is to predict.
Read More

Bookmaker Implicit Probabilities: Empirical Value of the Risk-Equalising Approach

A few blogs back I developed the idea that bookmakers might embed overround in each team's price not equally but instead such that the resulting head-to-head market prices provide insurance for a fixed (in percentage point terms) calibration error of equivalent size for both teams. Since then I've made only passing comment about the empirical superiority of this approach (which I've called the Risk-Equalising Approach) relative to the previous approach (which I've called the Overround-Equalising Approach).
Read More

Measuring Bookmaker Calibration Errors

We've found ample evidence in the past to assert that the TAB Bookmaker is well-calibrated, by which I mean that teams he rates as 40% chances tend to win about 40% of the time, teams he rates as 90% chances tend to win about 90% of the time and, more generally, that teams he rates as X% chances tend to win about X% of the time.
Read More

All You Ever Wanted to Know About Favourite-Longshot Bias ...

Previously, on at least a few occasions, I've looked at the topic of the Favourite-Longshot Bias and whether or not it exists in the TAB Sportsbet wagering markets for AFL.

A Favourite-Longshot Bias (FLB) is said to exist when favourites win at a rate in excess of their price-implied probability and longshots win at a rate less than their price-implied probability. So if, for example, teams priced at $10 - ignoring the vig for now - win at a rate of just 1 time in 15, this would be evidence for a bias against longshots. In addition, if teams priced at $1.10 won, say, 99% of the time, this would be evidence for a bias towards favourites.

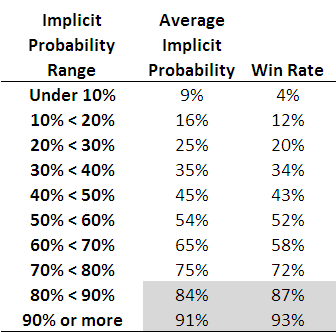
When I've considered this topic in the past I've generally produced tables such as the following, which are highly suggestive of the existence of such an FLB.

2010 - Favourite-Longshot Bias.png

Each row of this table, which is based on all games from 2006 to the present, corresponds to the results for teams with price-implied probabilities in a given range. The first row, for example, is for all those teams whose price-implied probability was less than 10%. This equates, roughly, to teams priced at $9.50 or more. The average implied probability for these teams has been 9%, yet they've won at a rate of only 4%, less than one-half of their 'expected' rate of victory.

As you move down the table you need to arrive at the second-last row before you come to one where the win rate exceed the expected rate (ie the average implied probability). That's fairly compelling evidence for an FLB.

This empirical analysis is interesting as far as it goes, but we need a more rigorous statistical approach if we're to take it much further. And heck, one of the things I do for a living is build statistical models, so you'd think that by now I might have thrown such a model at the topic ...

A bit of poking around on the net uncovered this paper which proposes an eminently suitable modelling approach, using what are called conditional logit models.

In this formulation we seek to explain a team's winning rate purely as a function of (the natural log of) its price-implied probability. There's only one parameter to fit in such a model and its value tells us whether or not there's evidence for an FLB: if it's greater than 1 then there is evidence for an FLB, and the larger it is the more pronounced is the bias.

When we fit this model to the data for the period 2006 to 2010 the fitted value of the parameter is 1.06, which provides evidence for a moderate level of FLB. The following table gives you some idea of the size and nature of the bias.

2010 - Favourite-Longshot Bias - Conditional Logit.png

The first row applies to those teams whose price-implied probability of victory is 10%. A fair-value price for such teams would be $10 but, with a 6% vig applied, these teams would carry a market price of around $9.40. The modelled win rate for these teams is just 9%, which is slightly less than their implied probability. So, even if you were able to bet on these teams at their fair-value price of $10, you'd lose money in the long run. Because, instead, you can only bet on them at $9.40 or thereabouts, in reality you lose even more - about 16c in the dollar, as the last column shows.

We need to move all the way down to the row for teams with 60% implied probabilities before we reach a row where the modelled win rate exceeds the implied probability. The excess is not, regrettably, enough to overcome the vig, which is why the rightmost entry for this row is also negative - as, indeed, it is for every other row underneath the 60% row.

Conclusion: there has been an FLB on the TAB Sportsbet market for AFL across the period 2006-2010, but it hasn't been generally exploitable (at least to level-stake wagering).

The modelling approach I've adopted also allows us to consider subsets of the data to see if there's any evidence for an FLB in those subsets.

I've looked firstly at the evidence for FLB considering just one season at a time, then considering only particular rounds across the five seasons.

2010 - Favourite-Longshot Bias - Year and Round.png

So, there is evidence for an FLB for every season except 2007. For that season there's evidence of a reverse FLB, which means that longshots won more often than they were expected to and favourites won less often. In fact, in that season, the modelled success rate of teams with implied probabilities of 20% or less was sufficiently high to overcome the vig and make wagering on them a profitable strategy.

That year aside, 2010 has been the year with the smallest FLB. One way to interpret this is as evidence for an increasing level of sophistication in the TAB Sportsbet wagering market, from punters or the bookie, or both. Let's hope not.

Turning next to a consideration of portions of the season, we can see that there's tended to be a very mild reverse FLB through rounds 1 to 6, a mild to strong FLB across rounds 7 to 16, a mild reverse FLB for the last 6 rounds of the season and a huge FLB in the finals. There's a reminder in that for all punters: longshots rarely win finals.

Lastly, I considered a few more subsets, and found:

  • No evidence of an FLB in games that are interstate clashes (fitted parameter = 0.994)
  • Mild evidence of an FLB in games that are not interstate clashes (fitted parameter = 1.03)
  • Mild to moderate evidence of an FLB in games where there is a home team (fitted parameter = 1.07)
  • Mild to moderate evidence of a reverse FLB in games where there is no home team (fitted parameter = 0.945)

FLB: done.

Coast-to-Coast Blowouts: Who's Responsible and When Do They Strike?

Previously, I created a Game Typology for home-and-away fixtures and then went on to use that typology to characterise whole seasons and eras.

In this blog we'll use that typology to investigate the winning and losing tendencies of individual teams and to consider how the mix of different game types varies as the home-and-away season progresses.

First, let's look at the game type profile of each team's victories and losses in season 2010.

2010 - Game Type by Team 2010.png

Five teams made a habit of recording Coast-to-Coast Comfortably victories this season - Carlton, Collingwood, Geelong, Sydney and the Western Bulldogs - all of them finalists, and all of them winning in this fashion at least 5 times during the season.

Two other finalists, Hawthorn and the Saints, were masters of the Coast-to-Coast Nail-Biter. They, along with Port Adelaide, registered four or more of this type of win.

Of the six other game types there were only two that any single team recorded on 4 occasions. The Roos managed four Quarter 2 Press Light victories, and Geelong had four wins categorised as Quarter 3 Press victories.

Looking next at loss typology, we find six teams specialising in Coast-to-Coast Comfortably losses. One of them is Carlton, who also appeared on the list of teams specialising in wins of this variety, reinforcing the point that I made in an earlier blog about the Blues' fate often being determined in 2010 by their 1st quarter performance.

The other teams on the list of frequent Coast-to-Coast Comfortably losers are, unsurprisingly, those from positions 13 through 16 on the final ladder, and the Roos. They finished 9th on the ladder but recorded a paltry 87.4 percentage, this the logical consequence of all those Coast-to-Coast Comfortably losses.

Collingwood and Hawthorn each managed four losses labelled Coast-to-Coast Nail-Biters, and West Coast lost four encounters that were Quarter 2 Press Lights, and four more that were 2nd-Half Revivals where they weren't doing the reviving.

With only 22 games to consider for each team it's hard to get much of a read on general tendencies. So let's increase the sample by an order of magnitude and go back over the previous 10 seasons.

2010 - Game Type by Team 2001-2010.png

Adelaide's wins have come disproportionately often from presses in the 1st or 2nd quarters and relatively rarely from 2nd-Half Revivals or Coast-to-Coast results. They've had more than their expected share of losses of type Q2 Press Light, but less than their share of Q1 Press and Coast-to-Coast losses. In particular, they've suffered few Coast-to-Coast Blowout losses.

Brisbane have recorded an excess of Coast-to-Coast Comfortably and Blowout victories and less Q1 Press, Q3 Press and Coast-to-Coast Nail-Biters than might be expected. No game type has featured disproportionately more often amongst their losses, but they have had relatively few Q2 Press and Q3 Press losses.

Carlton has specialised in the Q2 Press victory type and has, relatively speaking, shunned Q3 Press and Coast-to-Coast Blowout victories. Their losses also include a disportionately high number of Q2 Press losses, which suggests that, over the broader time horizon of a decade, Carlton's fate has been more about how they've performed in the 2nd term. Carlton have also suffered a disproportionately high share of Coast-to-Coast Blowouts - which is I suppose what a Q2 Press loss might become if it gets ugly - yet have racked up fewer than the expected number of Coast-to-Coast Nail-Biters and Coast-to-Coast Comfortablys. If you're going to lose Coast-to-Coast, might as well make it a big one.

Collingwood's victories have been disproportionately often 2nd-Half Revivals or Coast-to-Coast Blowouts and not Q1 Presses or Coast-to-Coast Nail-Biters. Their pattern of losses has been partly a mirror image of their pattern of wins, with a preponderance of Q1 Presses and Coast-to-Coast Nail-Biters and a scarcity of 2nd-Half Revivals. They've also, however, had few losses that were Q2 or Q3 Presses or that were Coast-to-Coast Comfortablys.

Wins for Essendon have been Q1 Presses or Coast-to-Coast Nail-Biters unexpectedly often, but have been Q2 Press Lights or 2nd-Half Revivals significantly less often than for the average team. The only game type overrepresented amongst their losses has been the Coast-to-Coast Comfortably type, while Coast-to-Coast Blowouts, Q1 Presses and, especially, Q2 Presses have been signficantly underrepresented.

Fremantle's had a penchant for leaving their runs late. Amongst their victories, Q3 Presses and 2nd-Half Revivals occur more often than for the average team, while Coast-to-Coast Blowouts are relatively rare. Their losses also have a disproportionately high showing of 2nd-Half Revivals and an underrepresentation of Coast-to-Coast Blowouts and Coast-to-Coast Nail-Biters. It's fair to say that Freo don't do Coast-to-Coast results.

Geelong have tended to either dominate throughout a game or to leave their surge until later. Their victories are disproportionately of the Coast-to-Coast Blowout and Q3 Press varieties and are less likely to be Q2 Presses (Regular or Light) or 2nd-Half Revivals. Losses have been Q2 Press Lights more often than expected, and Q1 Presses, Q3 Presses or Coast-to-Coast Nail-Biters less often than expected.

Hawthorn have won with Q2 Press Lights disproportionately often, but have recorded 2nd-Half Revivals relatively infrequently and Q2 Presses very infrequently. Q2 Press Lights are also overrepresented amongst their losses, while Q2 Presses and Coast-to-Coast Nail-Biters appear less often than would be expected.

The Roos specialise in Coast-to-Coast Nail-Biter and Q2 Press Light victories and tend to avoid Q2 and Q3 Presses, as well as Coast-to-Coast Comfortably and Blowout victories. Losses have come disproportionately from the Q3 Press bucket and relatively rarely from the Q2 Press (Regular or Light) categories. The Roos generally make their supporters wait until late in the game to find out how it's going to end.

Melbourne heavily favour the Q2 Press Light style of victory and have tended to avoid any of the Coast-to-Coast varieties, especially the Blowout variant. They have, however, suffered more than their share of Coast-to-Coast Comfortably losses, but less than their share of Coast-to-Coast Blowout and Q2 Press Light losses.

Port Adelaide's pattern of victories has been a bit like Geelong's. They too have won disproportionately often via Q3 Presses or Coast-to-Coast Blowouts and their wins have been underrepresented in the Q2 Press Light category. They've also been particularly prone to Q2 and Q3 Press losses, but not to Q1 Presses or 2nd-Half Revivals.

Richmond wins have been disproportionately 2nd-Half Revivals or Coast-to-Coast Nail-Biters, and rarely Q1 or Q3 Presses. Their losses have been Coast-to-Coast Blowouts disproportionately often, but Coast-to-Coast Nail-Biters and Q2 Press Lights relatively less often than expected.

St Kilda have been masters of the foot-to-the-floor style of victory. They're overrepresented amongst Q1 and Q2 Presses, as well as Coast-to-Coast Blowouts, and underrepresented amongst Q3 Presses and Coast-to-Coast Comfortablys. Their losses include more Coast-to-Coast Nail-Biters than the average team, and fewer Q1 and Q3 Presses, and 2nd-Half Revivals.

Sydney's loss profile almost mirrors the average team's with the sole exception being a relative abundance of Q3 Presses. Their profile of losses, however, differs significantly from the average and shows an excess of Q1 Presses, 2nd-Half Revivals and Coast-to-Coast Nail-Biters, a relative scarcity of Q3 Presses and Coast-to-Coast Comfortablys, and a virtual absence of Coast-to-Coast Blowouts.

West Coast victories have come disproportionately as Q2 Press Lights and have rarely been of any other of the Press varieties. In particular, Q2 Presses have been relatively rare. Their losses have all too often been Coast-to-Coast blowouts or Q2 Presses, and have come as Coast-to-Coast Nail-Biters relatively infrequently.

The Western Bulldogs have won with Coast-to-Coast Comfortablys far more often than the average team, and with the other two varieties of Coast-to-Coast victories far less often. Their profile of losses mirrors that of the average team excepting that Q1 Presses are somewhat underrepresented.

We move now from associating teams with various game types to associating rounds of the season with various game types.

You might wonder, as I did, whether different parts of the season tend to produce a greater or lesser proportion of games of particular types. Do we, for example, see more Coast-to-Coast Blowouts early in the season when teams are still establishing routines and disciplines, or later on in the season when teams with no chance meet teams vying for preferred finals berths?

2010 - Game Type by Round 2001-2010.png

For this chart, I've divided the seasons from 2001 to 2010 into rough quadrants, each spanning 5 or 6 rounds.

The Coast-to-Coast Comfortably game type occurs most often in the early rounds of the season, then falls away a little through the next two quadrants before spiking a little in the run up to the finals.

The pattern for the Coast-to-Coast Nail-Biter game type is almost the exact opposite. It's relatively rare early in the season and becomes more prevalent as the season progresses through its middle stages, before tapering off in the final quadrant.

Coast-to-Coast Blowouts occur relatively infrequently during the first half of the season, but then blossom, like weeds, in the second half, especially during the last 5 rounds when they reach near-plague proportions.

Quarter 1 and Quarter 2 Presses occur with similar frequencies across the season, though they both show up slightly more often as the season progresses. Quarter 2 Press Lights, however, predominate in the first 5 rounds of the season and then decline in frequency across rounds 6 to 16 before tapering dramatically in the season's final quadrant.

Quarter 3 Presses occur least often in the early rounds, show a mild spike in Rounds 6 to 11, and then taper off in frequency across the remainder of the season. 2nd-Half Revivals show a broadly similar pattern.

Trialling The Super Smart Model

The best way to trial a potential Fund algorithm, I'm beginning to appreciate, is to publish each week the forecasts that it makes. This forces me to work through the mechanics of how it would be used in practice and, importantly, to set down what restrictions should be applied to its wagering - for example should it, like most of the current Funds, only bet on Home Teams, and in which round of the season should it start wagering.
Read More

Goalkicking Accuracy Across The Seasons

Last weekend's goal-kicking was strikingly poor, as I commented in the previous blog, and this led me to wonder about the trends in kicking accuracy across football history. Just about every sport I can think of has seen significant improvements in the techniques of those playing and this has generally led to improved performance. If that applies to football then we could reasonably expect to see higher levels of accuracy across time.
Read More

Using a Ladder to See the Future

The main role of the competition ladder is to provide a summary of the past. In this blog we'll be assessing what they can tell us about the future. Specifically, we'll be looking at what can be inferred about the make up of the finals by reviewing the competition ladder at different points of the season.

I'll be restricting my analysis to the seasons 1997-2009 (which sounds a bit like a special category for Einstein Factor, I know) as these seasons all had a final 8, twenty-two rounds and were contested by the same 16 teams - not that this last feature is particularly important.

Let's start by asking the question: for each season and on average how many of the teams in the top 8 at a given point in the season go on to play in the finals?

2010 - In Top 8.png

The first row of the table shows how many of the teams that were in the top 8 after the 1st round - that is, of the teams that won their first match of the season - went on to play in September. A chance result would be 4, and in 7 of the 13 seasons the actual number was higher than this. On average, just under 4.5 of the teams that were in the top 8 after 1 round went on to play in the finals.

This average number of teams from the current Top 8 making the final Top 8 grows steadily as we move through the rounds of the first half of the season, crossing 5 after Round 2, and 6 after Round 7. In other words, historically, three-quarters of the finalists have been determined after less than one-third of the season. The 7th team to play in the finals is generally not determined until Round 15, and even after 20 rounds there have still been changes in the finalists in 5 of the 13 seasons.

Last year is notable for the fact that the composition of the final 8 was revealed - not that we knew - at the end of Round 12 and this roster of teams changed only briefly, for Rounds 18 and 19, before solidifying for the rest of the season.

Next we ask a different question: if your team's in ladder position X after Y rounds where, on average, can you expect it to finish.

2010 - Ave Finish.png

Regression to the mean is on abundant display in this table with teams in higher ladder positions tending to fall and those in lower positions tending to rise. That aside, one of the interesting features about this table for me is the extent to which teams in 1st at any given point do so much better than teams in 2nd at the same point. After Round 4, for example, the difference is 2.6 ladder positions.

Another phenomenon that caught my eye was the tendency for teams in 8th position to climb the ladder while those in 9th tend to fall, contrary to the overall tendency for regression to the mean already noted.

One final feature that I'll point out is what I'll call the Discouragement Effect (but might, more cynically and possibly accurately, have called it the Priority Pick Effect), which seems to afflict teams that are in last place after Round 5. On average, these teams climb only 2 places during the remainder of the season.

Averages, of course, can be misleading, so rather than looking at the average finishing ladder position, let's look at the proportion of times that a team in ladder position X after Y rounds goes on to make the final 8.

2010 - Percent Finish in 8.png

One immediately striking result from this table is the fact that the team that led the competition after 1 round - which will be the team that won with the largest ratio of points for to points against - went on to make the finals in 12 of the 13 seasons.

You can use this table to determine when a team is a lock or is no chance to make the final 8. For example, no team has made the final 8 from last place at the end of Round 5. Also, two teams as lowly ranked as 12th after 13 rounds have gone on to play in the finals, and one team that was ranked 12th after 17 rounds still made the September cut.

If your team is in 1st or 2nd place after 10 rounds you have history on your side for them making the top 8 and if they're higher than 4th after 16 rounds you can sport a similarly warm inner glow.

Lastly, if your aspirations for your team are for a top 4 finish here's the same table but with the percentages in terms of making the Top 4 not the Top 8.

2010 - Percent Finish in 4.png

Perhaps the most interesting fact to extract from this table is how unstable the Top 4 is. For example, even as late as the end of Round 21 only 62% of the teams in 4th spot have finished in the Top 4. In 2 of the 13 seasons a Top 4 spot has been grabbed by a team in 6th or 7th at the end of the penultimate round.