Predicting the Final Ladder

Discussions about the final finishing order of the 18 AFL teams are popular at the moment. In the past few weeks alone I've had an e-mail request for my latest prediction of the final ordering (which I don't have), a request to make regular updates during the season, a link to my earlier post on the teams' 2015 schedule strength turning up in a thread on the bigfooty site about the whole who-finishes-where debate, and a Twitter conversation about just how difficult it is, probabilistically speaking, to assign the correct ladder position to all 18 teams. 

Read More

How Often Does The Best Team Win The Flag?

Finals series are a significant part of Australian sporting life. No professional team sport I know determines its ultimate victor - as does, say the English Premier League - on the basis of a first-past-the-post system. There's no doubt that a series of Finals adds interest, excitement and theatre (and revenue) to a season, but, in the case of VFL/AFL at least, how often does it result in the best team being awarded the Flag?

Read More

VFL/AFL Home-and-Away Season Team Analysis

This year, Sydney collected its 8th Minor Premiership (including its record when playing as South Melbourne) drawing it level with Richmond in 7th place on the all-time list. That list is headed by Collingwood, whose 19 Minor Premierships have come from from the 118 seasons, one season more than Sydney/South Melbourne and 11 more than Richmond.  

Read More

Game Statistics and the Dream Team

Today, a new voice comes to MAFL. It's Andrew's. He's the guy that uncovered the treasure-trove of game statistics on the AFL website and he's kindly contributed a blog taking you through some of the analyses he's performed on that data. Let me be the first to say "welcome mate". I have lurked on the sidelines of MAFL and Matter of Stats for a couple of years and enjoyed many conversations with Tony about his blogs. I found myself infected with curiosity and so, with gratitude to Tony, here's my newbie blog post.
Read More

Does An Extra Day's Rest Matter in the Finals?

This week Collingwood faces Sydney having played its Semi-Final only 6 day previously while Adelaide take on Hawthorn a more luxurious 8 days after their Semi-Final encounter. The gap for Sydney has been 13 days while that for the Hawks has been 15 days. In this blog we'll assess what, if any, effect these differential gaps between games for competing finalists might have on game outcome.
Read More

2012 - Recent History of MARS Ratings and Ladder Positions

This year we finished the home-and-away season with 11 teams carrying MARS Ratings of over 1,000, hinting at the competitiveness we saw for positions in the Finals. MARS Ratings are zero-sum though, so a large crop of highly-rated teams necessitates a smaller crop of lowly-rated ones
Read More

Explaining More of the Variability in the Victory Margin of Finals

This morning while out walking I got to wondering about two of the results from the latest post on the Wagers & Tips blog. First that teams from higher on the ladder have won 20 of the 22 Semi Finals between 2000 and 2010, and second that the TAB bookmaker has installed the winning team as favourite in only 64% of these contests. Putting those two facts together it's apparent that, in Semi Finals at least, the bookmaker's often favoured the team that finished lower on the ladder, and these teams have rarely won.
Read More

Grand Final Margins Through History and a Last Look at the 2010 Home-and-Away Season

A couple of final charts before GF 2.0.

The first chart looks at the history of Grand Finals, again. Each point in the chart reflects four things about the Grand Final to which it pertains ...
Read More

Grand Final History: A Look at Ladder Positions

Across the 111 Grand Finals in VFL/AFL history - excluding the two replays - only 18 of them, or about 1-in-6, has seen the team finishing 1st on the home-and-away ladder play the team finishing 3rd.

This year, of course, will be the nineteenth.

Far more common, as you'd expect, has been a matchup between the teams from 1st and 2nd on the ladder. This pairing accounts for 56 Grand Finals, which is a smidgeon over half, and has been so frequent partly because of the benefits accorded to teams finishing in these positions by the various finals systems that have been in use, and partly no doubt because these two teams have tended to be the best two teams.

2010 - Grand Final Results by Ladder Position.png

In the 18 Grand Finals to date that have involved the teams from 1st and 3rd, the minor premier has an 11-7 record, which represents a 61% success rate. This is only slightly better than the minor premiers' record against teams coming 2nd, which is 33-23 or about 59%.

Overall, the minor premiers have missed only 13 of the Grand Finals and have won 62% of those they've been in.

By comparison, teams finishing 2nd have appeared in 68 Grand Finals (61%) and won 44% of them. In only 12 of those 68 appearances have they faced a team from lower on the ladder; their record for these games is 7-5, or 58%.

Teams from 3rd and 4th positions have each made about the same number of appearances, winning a spot about 1 year in 4. Whilst their rates of appearance are very similar, their success rates are vastly different, with teams from 3rd winning 46% of the Grand Finals they've made, and those from 4th winning only 27% of them.

That means that teams from 3rd have a better record than teams from 2nd, largely because teams from 3rd have faced teams other than the minor premier in 25% of their Grand Final appearances whereas teams from 2nd have found themselves in this situation for only 18% of their Grand Final appearances.

Ladder positions 5 and 6 have provided only 6 Grand Finalists between them, and only 2 Flags. Surprisingly, both wins have been against minor premiers - in 1998, when 5th-placed Adelaide beat North Melbourne, and in 1900 when 6th-placed Melbourne defeated Fitzroy. (Note that the finals systems have, especially in the early days of footy, been fairly complex, so not all 6ths are created equal.)

One conclusion I'd draw from the table above is that ladder position is important, but only mildly so, in predicting the winner of the Grand Final. For example, only 69 of the 111 Grand Finals, or about 62%, have been won by the team finishing higher on the ladder.

It turns out that ladder position - or, more correctly, the difference in ladder position between the two grand finalists - is also a very poor predictor of the margin in the Grand Final.

2010 - Grand Final Results by Ladder Position - Chart.png

This chart shows that there is a slight increase in the difference between the expected number of points that the higher-placed team will score relative to the lower-placed team as the gap in their respective ladder positions increases, but it's only half a goal per ladder position.

What's more, this difference explains only about half of one percentage of the variability in that margin.

Perhaps, I thought, more recent history would show a stronger link between ladder position difference and margin.

2010 - Grand Final Results by Ladder Position - Chart 2.png

Quite the contrary, it transpires. Looking just at the last 20 years, an increase in the difference of 1 ladder position has been worth only 1.7 points in increased expected margin.

Come the Grand Final, it seems, some of your pedigree follows you onto the park, but much of it wanders off for a good bark and a long lie down.

Which Teams Are Most Likely to Make Next Year's Finals?

I had a little time on a flight back to Sydney from Melbourne last Friday night to contemplate life's abiding truths. So naturally I wondered: how likely is it that a team finishing in ladder position X at the end of one season makes the finals in the subsequent season?

Here's the result for seasons 2000 to 2010, during which the AFL has always had a final 8:

2010 - Probability of Making the Finals by Ladder Position.png

When you bear in mind that half of the 16 teams have played finals in each season since 2000 this table is pretty eye-opening. It suggests that the only teams that can legitimately feel themselves to be better-than-random chances for a finals berth in the subsequent year are those that have finished in the top 4 ladder positions in the immediately preceding season. Historically, top 4 teams have made the 8 in the next year about 70% of the time - 100% of the time in the case of the team that takes the minor premiership.

In comparison, teams finishing 5th through 14th have, empirically, had roughly a 50% chance of making the finals in the subsequent year (actually, a tick under this, which makes them all slightly less than random chances to make the 8).

Teams occupying 15th and 16th have had very remote chances of playing finals in the subsequent season. Only one team from those positions - Collingwood, who finished 15th in 2005 and played finals in 2006 - has made the subsequent year's top 8.

Of course, next year we have another team, so that's even worse news for those teams that finished out of the top 4 this year.

A Competition of Two Halves

In the previous blog I suggested that, based on winning percentages when facing finalists, the top 8 teams (well, actually the top 7) were of a different class to the other teams in the competition.

Current MARS Ratings provide further evidence for this schism. To put the size of the difference in an historical perspective, I thought it might be instructive to review the MARS Ratings of teams at a similar point in the season for each of the years 1999 to 2010.

(This also provides me an opportunity to showcase one of the capabilities - strip-charts - of a sparklines tool that can be downloaded for free and used with Excel.)

2010 - Spread of MARS Ratings by Year.png

In the chart, each row relates the MARS Ratings that the 16 teams had as at the end of Round 22 in a particular season. Every strip in the chart corresponds to the Rating of a single team, and the relative position of that strip is based on the team's Rating - the further to the right the strip is, the higher the Rating.

The red strip in each row corresponds to a Rating of 1,000, which is always the average team Rating.

While the strips provide a visual guide to the spread of MARS Ratings for a particular season, the data in the columns at right offer another, more quantitative view. The first column is the average Rating of the 8 highest-rated teams, the middle column the average Rating of the 8 lowest-rated teams, and the right column is the difference between the two averages. Larger values in this right column indicate bigger differences in the MARS Ratings of teams rated highest compared to those rated lowest.

(I should note that the 8 highest-rated teams will not always be the 8 finalists, but the differences in the composition of these two sets of eight team don't appear to be material enough to prevent us from talking about them as if they were interchangeable.)

What we see immediately is that the difference in the average Rating of the top and bottom teams this year is the greatest that it's been during the period I've covered. Furthermore, the difference has come about because this year's top 8 has the highest-ever average Rating and this year's bottom 8 has the lowest-ever average Rating.

The season that produced the smallest difference in average Ratings was 1999, which was the year in which 3 teams finished just one game out of the eight and another finished just two games out. That season also produced the all-time lowest rated top 8 and highest rated bottom 8.

While we're on MARS Ratings and adopting an historical perspective (and creating sparklines), here's another chart, this one mapping the ladder and MARS performances of the 16 teams as at the end of the home-and-away seasons of 1999 to 2010.

2010 - MARS and Ladder History - 1999-2010.png

One feature of this chart that's immediately obvious is the strong relationship between the trajectory of each team's MARS Rating history and its ladder fortunes, which is as it should be if the MARS Ratings mean anything at all.

Other aspects that I find interesting are the long-term decline of the Dons, the emergence of Collingwood, Geelong and St Kilda, and the precipitous rise and fall of the Eagles.

I'll finish this blog with one last chart, this one showing the MARS Ratings of the teams finishing in each of the 16 ladder positions across seasons 1999 to 2010.

2010 - MARS Ratings Spread by Ladder Position.png

As you'd expect - and as we saw in the previous chart on a team-by-team basis - lower ladder positions are generally associated with lower MARS Ratings.

But the "weather" (ie the results for any single year) is different from the "climate" (ie the overall correlation pattern). Put another way, for some teams in some years, ladder position and MARS Rating are measuring something different. Whether either, or neither, is measuring what it purports to -relative team quality - is a judgement I'll leave in the reader's hands.

Using a Ladder to See the Future

The main role of the competition ladder is to provide a summary of the past. In this blog we'll be assessing what they can tell us about the future. Specifically, we'll be looking at what can be inferred about the make up of the finals by reviewing the competition ladder at different points of the season.

I'll be restricting my analysis to the seasons 1997-2009 (which sounds a bit like a special category for Einstein Factor, I know) as these seasons all had a final 8, twenty-two rounds and were contested by the same 16 teams - not that this last feature is particularly important.

Let's start by asking the question: for each season and on average how many of the teams in the top 8 at a given point in the season go on to play in the finals?

2010 - In Top 8.png

The first row of the table shows how many of the teams that were in the top 8 after the 1st round - that is, of the teams that won their first match of the season - went on to play in September. A chance result would be 4, and in 7 of the 13 seasons the actual number was higher than this. On average, just under 4.5 of the teams that were in the top 8 after 1 round went on to play in the finals.

This average number of teams from the current Top 8 making the final Top 8 grows steadily as we move through the rounds of the first half of the season, crossing 5 after Round 2, and 6 after Round 7. In other words, historically, three-quarters of the finalists have been determined after less than one-third of the season. The 7th team to play in the finals is generally not determined until Round 15, and even after 20 rounds there have still been changes in the finalists in 5 of the 13 seasons.

Last year is notable for the fact that the composition of the final 8 was revealed - not that we knew - at the end of Round 12 and this roster of teams changed only briefly, for Rounds 18 and 19, before solidifying for the rest of the season.

Next we ask a different question: if your team's in ladder position X after Y rounds where, on average, can you expect it to finish.

2010 - Ave Finish.png

Regression to the mean is on abundant display in this table with teams in higher ladder positions tending to fall and those in lower positions tending to rise. That aside, one of the interesting features about this table for me is the extent to which teams in 1st at any given point do so much better than teams in 2nd at the same point. After Round 4, for example, the difference is 2.6 ladder positions.

Another phenomenon that caught my eye was the tendency for teams in 8th position to climb the ladder while those in 9th tend to fall, contrary to the overall tendency for regression to the mean already noted.

One final feature that I'll point out is what I'll call the Discouragement Effect (but might, more cynically and possibly accurately, have called it the Priority Pick Effect), which seems to afflict teams that are in last place after Round 5. On average, these teams climb only 2 places during the remainder of the season.

Averages, of course, can be misleading, so rather than looking at the average finishing ladder position, let's look at the proportion of times that a team in ladder position X after Y rounds goes on to make the final 8.

2010 - Percent Finish in 8.png

One immediately striking result from this table is the fact that the team that led the competition after 1 round - which will be the team that won with the largest ratio of points for to points against - went on to make the finals in 12 of the 13 seasons.

You can use this table to determine when a team is a lock or is no chance to make the final 8. For example, no team has made the final 8 from last place at the end of Round 5. Also, two teams as lowly ranked as 12th after 13 rounds have gone on to play in the finals, and one team that was ranked 12th after 17 rounds still made the September cut.

If your team is in 1st or 2nd place after 10 rounds you have history on your side for them making the top 8 and if they're higher than 4th after 16 rounds you can sport a similarly warm inner glow.

Lastly, if your aspirations for your team are for a top 4 finish here's the same table but with the percentages in terms of making the Top 4 not the Top 8.

2010 - Percent Finish in 4.png

Perhaps the most interesting fact to extract from this table is how unstable the Top 4 is. For example, even as late as the end of Round 21 only 62% of the teams in 4th spot have finished in the Top 4. In 2 of the 13 seasons a Top 4 spot has been grabbed by a team in 6th or 7th at the end of the penultimate round.

A First Look at Grand Final History

In Preliminary Finals since 2000 teams finishing in ladder position 1 are now 3-0 over teams finishing 3rd, and teams finishing in ladder position 2 are 5-0 over teams finishing 4th.

Overall in Preliminary Finals, teams finishing in 1st now have a 70% record, teams finishing 2nd an 80% record, teams finishing 3rd a 38% record, and teams finishing 4th a measly 20% record. This generally poor showing by teams from 3rd and 4th has meant that we've had at least 1 of the top 2 teams in every Grand Final since 2000.

Finals_Summary_Wk3.png

Reviewing the middle table in the diagram above we see that there have been 4 Grand Finals since 2000 involving the teams from 1st and 2nd on the ladder and these contests have been split 2 apiece. No other pairing has occurred with a greater frequency.

Two of these top-of-the-table clashes have come in the last 2 seasons, with 1st-placed Geelong defeating 2nd-placed Port Adelaide in 2007, and 2nd-placed Hawthorn toppling 1st-placed Geelong last season. Prior to that we need to go back firstly to 2004, when 1st-placed Port Adelaide defeated 2nd-placed Brisbane Lions, and then to 2001 when 1st-placed Essendon surrendered to 2nd-placed Brisbane Lions.

Ignoring the replays of 1948 and 1977 there have been 110 Grand Finals in the 113-year history of the VFL/AFL history, with Grand Finals not being used in the 1897 or 1924 seasons. The pairings and win-loss records for each are shown in the table below.

GF_Records.png

As you can see, this is the first season that St Kilda have met Geelong in the Grand Final. Neither team has been what you'd call a regular fixture at the G come Grand Final Day, though the Cats can lay claim to having been there more often (15 times to the Saints' 5) and to having a better win-loss percentage (47% to the Saints' 20%).

After next weekend the Cats will move ahead of Hawthorn into outright 7th in terms of number of GF appearances. Even if they win, however, they'll still trail the Hawks by 2 in terms of number of Flags.

A Decade of Finals

This year represents the 10th under the current system of finals, a system I think has much to recommend it. It certainly seems to - justifiably, I'd argue - favour those teams that have proven their credentials across the entire season.

The table below shows how the finals have played out over the 10 years:

Finals_2009_W1.png

This next table summarises, on a one-week-of-the-finals-at-a-time basis, how teams from each ladder position have fared:

Finals_Summary_Wk1.png

Of particular note in relation to Week 1 of the finals is the performance of teams finishing 3rd and of those finishing 7th. Only two such teams - one from 3rd and one from 7th - have been successful in their respective Qualifying and Elimination Finals.

In the matchups of 1st v 4th and 5th v 8th the outcomes have been far more balanced. In the 1st v 4th clashes, it's been the higher ranked team that has prevailed on 6 of 10 occasions, whereas in the 5th v 8th clashes, it's been the lower ranked team that's won 60% of the time.

Turning our attention next to Week 2 of the finals, we find that the news isn't great for Adelaide or Lions fans. On both those occasions when 4th has met 5th in Week 2, the team from 4th on the ladder has emerged victorious, and on the 7 occasions that 3rd has faced 6th in Week 2, the team from 3rd on the ladder has won 5 and lost only 2.

Looking more generally at the finals, it's interesting to note that no team from ladder positions 5, 7 or 8 has made it through to the Preliminary Finals and, on the only two occasions that the team from position 6 has made it that far, none has progressed into the Grand Final.

So, teams only from positions 1 to 4 have so far contested Grand Finals, teams from 1st on 6 occasions, teams from 2nd on 7 occasions, teams from 3rd on 3 occasions, and teams from 4th only twice.

No team finishing lower than 3rd has yet won a Flag.

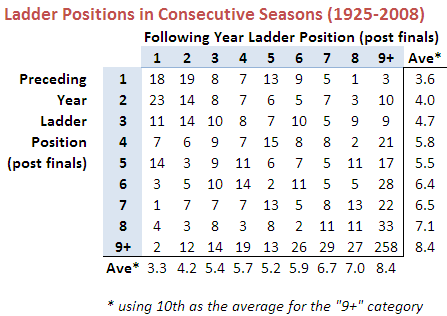
From One Year To The Next: Part 2

Last blog I promised that I'd take another look at teams' year-to-year changes in ladder position, this time taking a longer historical perspective.

For this purpose I've elected to use the period 1925 to 2008 as there have always been at least 10 teams in the competition from that point onwards. Once again in this analysis I've used each team's final ladder position, not their ladder position as at the end of the home and away season. Where a team has left or joined the competition in a particular season, I've omitted its result for the season in which it came (since there's no previous season) or went (since there's no next season).

As the number of teams making the finals has varied across the period we're considering, I'll not be drawing any conclusions about the rates of teams making or missing the finals. I will, however, be commenting on Grand Final participation as each season since 1925 has culminated in such an event.

Here's the raw data:

Ladder_Change_Val_25_08.png

(Note that I've grouped all ladder positions of 9th or lower in the "9+" category. In some years this incorporates just two ladder positions, in others as many as eight.)

A few things are of note in this table:

  • Losing Grand Finalists are more likely than winning Grand Finalists to win in the next season.
  • Only 10 of 83 winning Grand Finalists finished 6th or lower in the previous season.
  • Only 9 of 83 winning Grand Finalists have finished 7th or lower in the subsequent season.
  • The average ladder position of a team next season is highly correlated with its position in the previous season. One notable exception to this tendency is for teams finishing 4th. Over one quarter of such teams have finished 9th or worse in the subsequent season, which drags their average ladder position in the subsequent year to 5.8, below that of teams finishing 5th.
  • Only 2 teams have come from 9th or worse to win the subsequent flag - Adelaide, who won in 1997 after finishing 12th in 1996; and Geelong, who won in 2007 after finishing 10th in 2006.
  • Teams that finish 5th have a 14-3 record in Grand Finals that they've made in the following season. In percentage terms this is the best record for any ladder position.

Here's the same data converted into row percentages.

Ladder_Change_PC_25_08.png

Looking at the data in this way makes a few other features a little more prominent:

  • Winning Grand Finalists have about a 45% probability of making the Grand Final in the subsequent season and a little under a 50% chance of winning it if they do.
  • Losing Grand Finalists also have about a 45% probability of making the Grand Final in the subsequent season, but they have a better than 60% record of winning when they do.
  • Teams that finish 3rd have about a 30% chance of making the Grand Final in the subsequent year. They're most likely to be losing Grand Finalists in the next season.
  • Teams that finish 4th have about a 16% chance of making the Grand Final in the subsequent year. They're most likely to finish 5th or below 8th. Only about 1 in 4 improve their ladder position in the ensuing season.
  • Teams that finish 5th have about a 20% chance of making the Grand Final in the subsequent year. These teams tend to the extremes: about 1 in 6 win the flag and 1 in 5 drops to 9th or worse. Overall, there's a slight tendency for these teams to drop down the ladder.
  • Teams that finish 6th or 7th have about a 20% chance of making the Grand Final in the subsequent year. Teams finishing 6th tend to drop down the ladder in the next season; teams finishing 7th tend to climb.
  • Teams that finish 8th have about a 8.5% chance of making the Grand Final in the subsequent year. These teams tend to climb in the ensuing season.
  • Teams that finish 9th or worse have about a 3.5% chance of making the Grand Final in the subsequent year. They also have a roughly 2 in 3 chance of finishing 9th or worse again.

So, I suppose, relatively good news for Cats fans and perhaps surprisingly bad news for St Kilda fans. Still, they're only statistics.

From One Year To The Next: Part 1

With Carlton and Essendon currently sitting in the top 8, I got to wondering about the history of teams missing the finals in one year and then making it the next. For this first analysis it made sense to choose the period 1997 to 2008 as this is the time during which we've had the same 16 teams as we do now.

For that period, as it turns out, the chances are about 1 in 3 that a team finishing 9th or worse in one year will make the finals in the subsequent year. Generally, as you'd expect, the chances improve the higher up the ladder that the team finished in the preceding season, with teams finishing 11th or higher having about a 50% chance of making the finals in the subsequent year.

Here's the data I've been using for the analysis so far:

Ladder_Change_Val_97_08.png

And here's that same data converted into row percentages and grouping the Following Year ladder positions.

Ladder_Change_PC_97_08.png

Note that in these tables I've used each team's final ladder position, not their ladder position as at the end of the home and away season. So, for example, Geelong's 2008 ladder position would be 2nd, not 1st.

Teams that make the finals in a given year have about a 2 in 3 chance of making the finals in the following year. Again, this probability tends to increase with higher ladder position: teams finishing in the top 4 places have a better than 3 in 4 record for making the subsequent year's finals.

One of the startling features of these tables is just how much better flag winners perform in subsequent years than do teams from any other position. In the first table, under the column headed "Ave" I've shown the average next-season finishing position of teams finishing in any given position. So, for example, teams that win the flag, on average, finish in position 3.5 on the subsequent year's ladder. This average is bolstered by the fact that 3 of the 11 (or 27%) premiers have gone back-to-back and 4 more (another 36%) have been losing Grand Finalists. Almost 75% have finished in the top 4 in the subsequent season.

Dropping down one row we find that the losing Grand Finalist from one season fares much worse in the next season. Their average ladder position is 6.6, which is over 3 ladder spots lower than the average for the winning Grand Finalist. Indeed, 4 of the teams that finished 2nd in one season missed the finals in the subsequent year. This is true of only 1 winning Grand Finalist.

In fact, the losing Grand Finalists don't tend to fare any better than the losing Preliminary Finalists, who average positions 6.0 (3rd) and 6.8 (4th).

The next natural grouping of teams based on average ladder position in the subsequent year seems to be those finishing 5th through 11th. Within this group the outliers are teams finishing 6th (who've tended to drop 3.5 places in the next season) and teams finishing 9th (who've tended to climb 1.5 places).

The final natural grouping includes the remaining positions 12th through 16th. Note that, despite the lowly average next-year ladder positions for these teams, almost 15% have made the top 4 in the subsequent year.

A few points of interest on the first table before I finish:

  • Only one team that's finished below 6th in one year has won the flag in the next season: Geelong, who finished 10th in 2006 and then won the flag in 2007
  • The largest season-to-season decline for a premier is Adelaide's fall from the 1998 flag to 13th spot in 1999.
  • The largest ladder climb to make a Grand Final is Melbourne's rise from 14th in 1999 to become losing Grand Finalists to Essendon in 2000.

Next time we'll look at a longer period of history.

Limning the Ladder

It's time to consider the grand sweep of football history once again.

This time I'm looking at the teams' finishing positions, in particular the number and proportion of times that they've each finished as Premiers, Wooden Spooners, Grand Finalists and Finalists, or that they've finished in the Top Quarter or Top Half of the draw.

Here's a table providing the All-Time data.

Teams_All_Time.png

Note that the percentage columns are all as a percentage of opportunities. So, for a season to be included in the denominator for a team's percentage, that team needs to have played in that season and, in the case of the Grand Finalists and Finalists statistics, there needs to have been a Grand Final (which there wasn't in 1897 or 1924) or there needs to have been Finals (which, effectively, there weren't in 1898, 1899 or 1900).

Looking firstly at Premierships, in pure number terms Essendon and Carlton tie for the lead on 16, but Essendon missed the 1916 and 1917 seasons and so have the outright lead in terms of percentage. A Premiership for West Coast in any of the next 5 seasons (and none for the Dons) would see them overtake Essendon on this measure.

Moving then to Spoons, St Kilda's title of the Team Most Spooned looks safe for at least another half century as they sit 13 clear of the field, and University will surely never relinquish the less euphonius but at least equally as impressive title of the Team With the Greatest Percentage of Spooned Seasons. Adelaide, Port Adelaide and West Coast are the only teams yet to register a Spoon (once the Roos' record is merged with North Melbourne's).

Turning next to Grand Finals we find that Collingwood have participated in a remarkable 39 of them, which equates to a better than one season in three record and is almost 10 percentage points better than any other team. West Coast, in just 22 seasons, have played in as many Grand Finals as have St Kilda, though St Kilda have had an additional 81 opportunities.

The Pies also lead in terms of the number of seasons in which they've participated in the Finals, though West Coast heads them in terms of percentages for this same statistic, having missed the Finals less than one season in four across the span of their existence.

Finally, looking at finishing in the Top Half or Top Quarter of the draw we find the Pies leading on both of these measures in terms of number of seasons but finishing runner-up to the Eagles in terms of percentages.

The picture is quite different if we look just at the 1980 to 2008 period, the numbers for which appear below.

Teams_80_08.png

Hawthorn now dominates the Premiership, Grand Finalist and finishing in the Top Quarter statistics. St Kilda still own the Spoon market and the Dons lead in terms of being a Finalist most often and finishing in the Top Half of the draw most often.

West Coast is the team with the highest percentage of Finals appearances and highest percentage of times finishing in the Top Half of the draw.