Are the Victory Margins for Some Games Harder to Predict than for Others?
/It's unarguable that the winner of some games will be harder to predict than the winner of others. When genuine equal-favourites meet, for example, you've only a 50:50 chance of picking the winner, but you can give yourself a 90% chances of being right when a team with a 90% probability of victory meets a team with only a 10% chance. The nearer to equal-favouritism the two teams are, the more difficult the winner is to predict, and the further away we are from this situation the easier the game is to predict.
If you want to quantify this, Entropy, or "expected surprisals", will do exactly that for you.
That's not the sort of predictive difficulty I want to explore today though. Instead I want to look at whether the final victory margin is harder to predict for some games than for others. In particular, I'll be investigating the extent to which the final victory margins varies about its pre-game expected value, and whether this variability can be explained by any of the following game characteristics:
- The pre-game Home team probability (as measured by the LPSO Implicit Probability, which is the inverse of the Home team price less 1.0281% points)
- The Interstate Status of the game
- The MARS Ratings of the Home and the Away teams, and the ratio of these Ratings
- The Venue Experience of the Home and the Away teams
THE EXPECTED VICTORY MARGIN
To quantify how unlikely was the final victory margin in a game, we first need to determine a reasonable pre-game estimate for its mean. For this purpose I'll be using the LPSO based Margin Predictor I introduced a few blogs back, which is as good a margin predictor as any I've ever produced.
If this measure is a good estimator of the mean of a game's victory margin then the random variable formed by subtracting it from the actual game victory margin should have an unconditional expected value of zero, and also a conditional expected value of zero when calculated for any subset of games, however defined. So, before continuing, we should just check to see if this measure demonstrates any systematic bias in terms of the game characteristics I've listed above, because any such bias might will tend to cloud the issue of whether greater variability about the mean is due to greater real underlying variability or due to the fact that variability is being measured from a biased mean.
CORRELATES OF PREDICTION ERRORS
Here are a series of charts investigating the relationship between the prediction error, defined as the actual victory margin less that predicted using the LPSO based Margin Predictor, for a game (or group of games) and a specific game characteristic. Bias will be indicated by the extent to which the averages shown in the charts stray "too far" from zero.
To prevent this blog from becoming too long, I've created smaller thumbnails for these images than I would normally. Please click on them to access larger versions.


The first chart provides density plots for the Prediction Errors for games from seven defined portions of the season, designated by Round number. So, for example, the leftmost density plot relates to games from the first 4 rounds of seasons 2007 to 2012 only. (The density plots are sideways to their conventional presentation since this facilitates comparison of their means [shown as blue lines] and their medians [shown as red lines].)
You can see that the means and medians do differ from zero across the portions of the season, but only slightly. They average below zero for the first four rounds of the season, above zero for the next four rounds, and so on. Most noticeable is the positive average for games from the Finals series, which suggests that Home teams do consistently better than expected in Finals (or, I guess, that TAB prices are distorted such that this appears to be the case, which would require that Home teams be priced a little too generously). The positive deviations for games from Rounds 17-21 also look relatively large.
The second chart is a scatter and associated loess plot for Prediction Error versus pre-game Implicit Home team Probability, and shows a general tendency for Home teams to produce victory margins of about the expected size, regardless of their pre-game Implicit Probability. Where the data is most dense, however, there is a hint that less-favoured Home teams do slightly better than expected while more-favoured teams do slightly worse. (Note that I've constrained the scale on this and all subsequent scatter plots to the interval [-100, 100], which means that these charts omit 10 observations.)
Next is a scatter and loess for Prediction Error versus the MARS Rating Ratio. It suggests that, within the range of most-commonly observed MARS Ratios (0.95 to 1.05), Home teams tend to fare very marginally better than expected when they are inferior to the Away team (MARS Rating Ratio < 1) or superior (MARS Rating Ratio >1) compared to when their Rating is very similar to the Away team's (MARS Rating Ratio ~ 1). Whether this relationship is statistically significant remains to be seen.
In the second row, on the left is the density plot for Interstate and Non-Interstate games showing virtually no difference in the prediction error distributions for these two game types. (Note that I've treated the handful of games where the Home team is playing out of its home State and the Away team is playing in its home State and Non-Interstate games.)
Next come two separate scatter and loess plots, one for Prediction Error versus Home team MARS Rating and the other for Prediction Error versus Away team MARS Rating. The first suggests, if we focus on the most-common Ratings, which are in the 980 to 1,020 range, that more-highly Rated Home teams tend to do marginally better than expected, and less-highly Rated Home teams do marginally worse than expected. The second suggests that, in this same Ratings range, Away teams do about as well as expected. Once more the broad conclusion would be that the relationship, if any, is weak.
The final two charts provide scatter and loess plots for Prediction Error versus Home team Venue Experience and Away team Venue Experience. In both, where the data is mostly concentrated, the lines are fairly flat suggesting no strong relationship between Prediction Error and the Venue Experience of either the Home or the Away teams.
We can measure the individual and aggregate relationship between the variables discussed above with Prediction Error by fitting statistical models. To test the strength of linear relationships we fit a least-squares regression, and to investigate the possibility of non-linear relationships, we fit a conditional inference forest.
Both come to much the same conclusion: individually, and in aggregate, the variables explain very little of the variability in Prediction Error - about 1 to 2% at most (using the out-of-bag predictions for the conditional inference tree). The linear model calls out as statistically significant however the relationship between Prediction Error and a few of the variables flagging different portions of the season - specifically, Rounds 17 to 20, and the Finals - and between Prediction Error and Home team Implicit Probability, so we can't confidently say that there's no bias at all in the LPSO based Margin Predictor for all game types.
If there is a real bias in relation to Round number it's not one I'm especially concerned about since, Finals aside, it's hard to mount a case as to why the Bookmaker's head-to-head prices - and, by inference, his victory margin prediction - should be a poorer reflection of the true expected victory margin in some portions of the season than in others, and in the same portions of the season from one year to the next, at that.
The potential bias that emerges conditioning on Implicit Home team Probability is a little more problematic, however, and one I can't simply dismiss due to a small effect size. The coefficient on the Implicit Home team Probability in the regression model is -22.9, which means that the difference in the expected Prediction Error is almost 4 goals if we move from a no-chance Home team to an absolute certainty. That said, the correlation between Implicit Home team Probability and the MARS Ratio is about 0.6, and there are also correlations with the Home and Away team Ratings individually too, so the change in the fitted Prediction Error would not be as large as 22.9 points as we move from 0% to 100% for the Home team Implicit Probability.
My conclusion then is that the LPSO based Margin Predictor provides a reasonable estimate of the expected victory margin in most games, except perhaps for games with extreme Home team Implicit Probabilities and for Finals.
CORRELATES OF ABSOLUTE PREDICTION ERRORS
Let's move then onto an assessment of the relationship between these same game characteristics and the Absolute Prediction Error, which as noted we're taking as a proxy of how difficult the game victory margin was to predict.
Again we chart the same set of relationships.


The first chart reveals that the mean and median Absolute Prediction Errors differ across portions of the season, being high for the first four rounds of the season, lower for Rounds 5 to 8, and then rising for all of the remaining home-and-away portions of the season, only to decline a little in the Finals. Intuitively though, it seems hard to rule out that these differences are due solely to chance.
The second chart, for Absolute Prediction Error versus Home team Implicit Probability, hints at slightly larger average prediction errors for Home team underdogs. In other words, Home team underdogs tend to produce lower victory margins than expected - that is, smaller losses, assuming that they lose. But here too the deviations in the loess fitted line from the overall mean absolute prediction error seem relatively small and probably not statistically significant. (Note that, I've constrained the scale on this and all subsequent scatter plots to the interval (0, 100), which means that these charts omit 10 observations.).
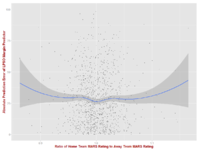
Next we have the plot for Absolute Prediction Error versus the MARS Rating Ratio, which suggests that Home teams tend to fare better than expected when they are significantly inferior to the Away team (small MARS Rating Ratio) or significantly superior (large MARS Rating Ratio). Ratios much outside the 0.95 to 1.05 range are fairly rare, however, and within this range Home team performances are far more in keeping with expectation.
In row two, the density plot for Interstate and Non-Interstate games shows virtually no difference in the prediction error distributions for these two game types. (Note that I've again treated the handful of games where the Home team is playing out of its home State and the Away team is playing in its home State and Non-Interstate games.)
The plots for Absolute Prediction Error versus Home team and Away team MARS Ratings suggest that, if we focus on the most-common Ratings, which are in the 980 to 1,020 range, Home teams further in absolute terms from an average Rating of 1,000 do better than Home teams Rated nearer to 1,000, relative to Bookmaker expectations, and that, in this same Ratings range, the opposite is true for Away teams. Yet again though the differences seem relatively minor.
The final two charts for Absolute Prediction Error versus Home team Venue Experience and Away team Venue Experience are both fairly flat where the data is most concentrated, suggesting no strong relationship between Absolute Prediction Error and the Venue Experience of either the Home or the Away teams.
Once more we assess the significance of these relationships individually and in aggregate by fitting a linear and a non-linear regression model. What we find is that the fits are even worse, with the proportion of variance explained about 1% or less. In the linear model we find no statistically significant coefficients. This implies that, at least in terms of the characteristics I've included, there's no systematic relationship between game characteristic and the variability of victory margin, measured as the absolute deviation from the expected margin.
SUMMARY
In summary, there's scant evidence that the victory margins for any particular class of games are harder to predict than those for any other class. To me this is counter-intuitive. It's quite extraordinary, I'd suggest, to assert that games that pit weak teams against strong or that bring together teams of similar strength; games that involve travel for one team, both or neither; and games that involve teams of any combination of Venue Experience from drive-there-blindfolded familiar to need-a-street-map novel, are all expected to produce victory margins with the same general level of variability - of predictability.
That means, for example, that a $1.01 favourite is just as likely to cover the spread it's offering by 30 points as is a team that is a $1.85 favourite. The spreads in these two games will be different, as will the size of the expected victory margin, but the variability around that margin will be the same.
