All You Ever Wanted to Know About Favourite-Longshot Bias ...
/Previously, on at least a few occasions, I've looked at the topic of the Favourite-Longshot Bias and whether or not it exists in the TAB Sportsbet wagering markets for AFL.
A Favourite-Longshot Bias (FLB) is said to exist when favourites win at a rate in excess of their price-implied probability and longshots win at a rate less than their price-implied probability. So if, for example, teams priced at $10 - ignoring the vig for now - win at a rate of just 1 time in 15, this would be evidence for a bias against longshots. In addition, if teams priced at $1.10 won, say, 99% of the time, this would be evidence for a bias towards favourites.
When I've considered this topic in the past I've generally produced tables such as the following, which are highly suggestive of the existence of such an FLB.
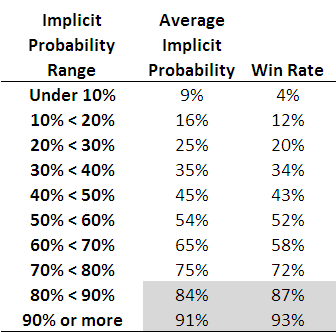
Each row of this table, which is based on all games from 2006 to the present, corresponds to the results for teams with price-implied probabilities in a given range. The first row, for example, is for all those teams whose price-implied probability was less than 10%. This equates, roughly, to teams priced at $9.50 or more. The average implied probability for these teams has been 9%, yet they've won at a rate of only 4%, less than one-half of their 'expected' rate of victory.
As you move down the table you need to arrive at the second-last row before you come to one where the win rate exceed the expected rate (ie the average implied probability). That's fairly compelling evidence for an FLB.
This empirical analysis is interesting as far as it goes, but we need a more rigorous statistical approach if we're to take it much further. And heck, one of the things I do for a living is build statistical models, so you'd think that by now I might have thrown such a model at the topic ...
A bit of poking around on the net uncovered this paper which proposes an eminently suitable modelling approach, using what are called conditional logit models.
In this formulation we seek to explain a team's winning rate purely as a function of (the natural log of) its price-implied probability. There's only one parameter to fit in such a model and its value tells us whether or not there's evidence for an FLB: if it's greater than 1 then there is evidence for an FLB, and the larger it is the more pronounced is the bias.
When we fit this model to the data for the period 2006 to 2010 the fitted value of the parameter is 1.06, which provides evidence for a moderate level of FLB. The following table gives you some idea of the size and nature of the bias.

The first row applies to those teams whose price-implied probability of victory is 10%. A fair-value price for such teams would be $10 but, with a 6% vig applied, these teams would carry a market price of around $9.40. The modelled win rate for these teams is just 9%, which is slightly less than their implied probability. So, even if you were able to bet on these teams at their fair-value price of $10, you'd lose money in the long run. Because, instead, you can only bet on them at $9.40 or thereabouts, in reality you lose even more - about 16c in the dollar, as the last column shows.
We need to move all the way down to the row for teams with 60% implied probabilities before we reach a row where the modelled win rate exceeds the implied probability. The excess is not, regrettably, enough to overcome the vig, which is why the rightmost entry for this row is also negative - as, indeed, it is for every other row underneath the 60% row.
Conclusion: there has been an FLB on the TAB Sportsbet market for AFL across the period 2006-2010, but it hasn't been generally exploitable (at least to level-stake wagering).
The modelling approach I've adopted also allows us to consider subsets of the data to see if there's any evidence for an FLB in those subsets.
I've looked firstly at the evidence for FLB considering just one season at a time, then considering only particular rounds across the five seasons.

So, there is evidence for an FLB for every season except 2007. For that season there's evidence of a reverse FLB, which means that longshots won more often than they were expected to and favourites won less often. In fact, in that season, the modelled success rate of teams with implied probabilities of 20% or less was sufficiently high to overcome the vig and make wagering on them a profitable strategy.
That year aside, 2010 has been the year with the smallest FLB. One way to interpret this is as evidence for an increasing level of sophistication in the TAB Sportsbet wagering market, from punters or the bookie, or both. Let's hope not.
Turning next to a consideration of portions of the season, we can see that there's tended to be a very mild reverse FLB through rounds 1 to 6, a mild to strong FLB across rounds 7 to 16, a mild reverse FLB for the last 6 rounds of the season and a huge FLB in the finals. There's a reminder in that for all punters: longshots rarely win finals.
Lastly, I considered a few more subsets, and found:
- No evidence of an FLB in games that are interstate clashes (fitted parameter = 0.994)
- Mild evidence of an FLB in games that are not interstate clashes (fitted parameter = 1.03)
- Mild to moderate evidence of an FLB in games where there is a home team (fitted parameter = 1.07)
- Mild to moderate evidence of a reverse FLB in games where there is no home team (fitted parameter = 0.945)
FLB: done.
