Which Teams Fare Better as Favourites?

In this blog, the next is a series in which I've been exploring the all-time MARS Ratings I created for every game from the start of 1897 to the end of the 2012 season, I'll be looking at how well each team has performed depending on the relative strength of its opponent, as measured by their MARS Rating. So, for example, we'll consider how well Collingwood tends to do when playing a team it is assessed as being much stronger than, a little stronger than, about as capable as, and so on.
Read More

The Greatest Upset Victories in VFL/AFL History (1897-2012)

The Suns' victory over the Saints in the first round of the 2013 season was heralded as an "upset win" for the Suns and one of the greatest in their short history. Undoubtedly their win was unexpected, but even the bookmakers rated the Suns as only $3.75 chances, so it was hardly a Halley's comet-like occurrence.
Read More

Team MARS Ratings Performance By Decade and Overall: 1897 to 2012

In the previous blog on the topic of all-time MARS Ratings I explained the process I used to derive team Ratings across history and then identified those teams that had achieved the highest (Essendon) and lowest (Fitzroy) MARS Ratings ever. We know then which teams have burned brightest - and which flickered dimmest - across VFL/AFL history. In this blog I want to explore more extended bursts of talent or apparent lack of it.
Read More

Defensive and Offensive Abilities : Do They Persist Across Seasons?

In the previous blog we reviewed the relationship between teams' winning percentages in one season and their winning percentages in subsequent seasons. We found that the relationship was moderate to strong from one season to the next and then tapered off fairly quickly over the course of the next couple of seasons so that, by the time a season was three years distant, it told us relatively little about a team's likely winning percentage. There is, of course, an inextricable link between winning and scoring, and in this blog we'll investigate the temporal relationships in teams' scoring in much the same way as we investigated the temporal relationships in teams' winning in that previous blog.
Read More

The Changing Nature of Home Team Probability

The original motivation for this blog was to provide additional context for the previous blog on victory probabilities for portions of games. That blog looked at the relationship between the TAB Bookmaker's pre-game assessment of the Home team's chances and the subsequent success or otherwise of the Home team in portions - Quarters, Halfs and so on - of the game under review.
Read More

Lead Changes as a Measure of Game Competitiveness

The final victory margin is one measure of how close a contest was, but it can sometimes mislead when the team that's in front midway through the final term piles on a slew of late goals against a progressively more demoralised opponent, improving its percentage in so doing, but also erasing any trace of the fact that the game might have been a close-run thing throughout the first three-and-a-half or more quarters.
Read More

Characterising AFL Seasons

I can think of a number of ways that an AFL season might be characterised but for today's blog I'm going to call on a modelling approach that I used back in 2010, which is based on Brownian motion and which was inspired by a JASA paper from Hal S Stern.
Read More

Does An Extra Day's Rest Matter in the Finals?

This week Collingwood faces Sydney having played its Semi-Final only 6 day previously while Adelaide take on Hawthorn a more luxurious 8 days after their Semi-Final encounter. The gap for Sydney has been 13 days while that for the Hawks has been 15 days. In this blog we'll assess what, if any, effect these differential gaps between games for competing finalists might have on game outcome.
Read More

2012 - Recent History of MARS Ratings and Ladder Positions

This year we finished the home-and-away season with 11 teams carrying MARS Ratings of over 1,000, hinting at the competitiveness we saw for positions in the Finals. MARS Ratings are zero-sum though, so a large crop of highly-rated teams necessitates a smaller crop of lowly-rated ones
Read More

1897 to 2011 : Winners v Losers - Leads, Scoring Shots and Conversion

In the previous blog, among other things we analysed which quarter winning teams win. We might also ask about winnng teams, in what proportion of games do they trail at the end of a particular quarter, and how has this proportion tracked over the seasons.
Read More

Measures of Game Competitiveness

All this analysis of victory margins, and a query from Dan about a recent blog post, has had me wondering about victory margin as a measure of the competitiveness of games. Within a given era - say 10 years or so - during which the average points scored per game won't vary by too much, victory margin seems to be a reasonable proxy for competitiveness, but if you want to consider a broader swathe of AFL history, it strikes me as being deficient.
Read More

Margins of Victory Across the Seasons

This year MAFL Investors will be taking on the TAB bookmaker in a new arena by attempting to pick the final victory margin for each game within a 10-point range. Having not wagered in this market I've no bedrock of intuitions - nor misconceptions - about it yet; I thought I'd start with a little historical analysis.
Read More

Explaining More of the Variability in the Victory Margin of Finals

This morning while out walking I got to wondering about two of the results from the latest post on the Wagers & Tips blog. First that teams from higher on the ladder have won 20 of the 22 Semi Finals between 2000 and 2010, and second that the TAB bookmaker has installed the winning team as favourite in only 64% of these contests. Putting those two facts together it's apparent that, in Semi Finals at least, the bookmaker's often favoured the team that finished lower on the ladder, and these teams have rarely won.
Read More

A First Look At Surprisals for 2011

We first discussed surprisals back in 2009 (if you perform a site search using the term "surprisals" you'll be linked to a couple of PDFs as well as to a handful of blog posts on the topic) as a method for quantifying the surprise associated with the outcome of a football game.
Read More

Grand Final Margins Through History and a Last Look at the 2010 Home-and-Away Season

A couple of final charts before GF 2.0.

The first chart looks at the history of Grand Finals, again. Each point in the chart reflects four things about the Grand Final to which it pertains ...
Read More

Pies v Saints: An Initial Prediction

During the week I'm sure I'll have a number of attempts at predicting the result of the Grand Final - after all, the more predictions you make about the same event, the better your chances of generating at least one that's remembered for its accuracy, long after the remainder have faded from memory.

In this brief blog the entrails I'll be contemplating come from a review of the relationship between Grand Finalists' MARS Ratings and the eventual result for each of the 10 most recent Grand Finals.

Firstly, here's the data:

2010 - Grand Finals and MARS Ratings.png

In seven of the last 10 Grand Finals the team with the higher MARS Rating has prevailed. You can glean this from the fact that the rightmost column contains only three negative values indicating that the team with the higher MARS Rating scored fewer points in the Grand Final than the team with the lower MARS Rating.

What this table also reveals is that:

  • Collingwood are the highest-rated Grand Finalist since Geelong in 2007 (and we all remember how that Grand Final turned out)
  • St Kilda are the lowest-rated Grand Finalist since Port Adelaide in 2007 (refer previous parenthetic comment)
  • Only one of the three 'upset' victories from the last decade, where upset is defined based on MARS Ratings, was associated with a higher MARS Rating differential. This was the Hawks' victory over Geelong in 2008 when the Hawks' MARS Rating was almost 29 points less than the Cats'

From the raw data alone it's difficult to determine if there's much of a relationship between the Grand Finalists' MARS Ratings and their eventual result. Much better to use a chart:

2010 - Grand Finals and MARS Ratings - Model.png

The dots each represent a single Grand Final and the line is the best fitting linear relationship between the difference in MARS Ratings and the eventual Grand Final score difference. As well as showing the line, I've also included the equation that describes it, which tells us that the best linear predictor of the Grand Final margin is that the team with the higher MARS Rating will win by a margin equal to about 1.06 times the difference in the teams' MARS Ratings less a bit under 1 point.

For this year's Grand Final that suggests that Collingwood will win by 1.062 x 26.1 - 0.952, which is just under 27 points. (I've included this in gray in the table above.)

One measure of the predictive power of the equation I've used here is the proportion of variability in Grand Final margins that it's explained historically. The R-squared of 0.172 tells us that this proportion is about 17%, which is comforting without being compelling.

We can also use a model fitted to the last 10 Grand Finals to create what are called confidence intervals for the final result. For example, we can say that there's a 50% chance that the result of the Grand Final will be in the range spanning a 5-point loss for the Pies to a 59-point win, which demonstrates just how difficult it is to create precise predictions when you've only 10 data points to play with.

Visualising AFL Grand Final History

I'm getting in early with the Grand Final postings.

The diagram below summarises the results of all 111 Grand Finals in history, excluding the drawn Grand Finals of 1948 and 1977, and encodes information in the following ways:

  • Each circle represents a team. Teams can appear once or twice (or not at all) - as a red circle as Grand Final losers and as a green circle as Grand Final winners.
  • Circle size if proportional to frequency. So, for example, a big red circle, such as Collingwood's denotes a team that has lost a lot of Grand Finals.
  • Arrows join Grand Finalists and emanate from the winning team and terminate at the losing team. The wider the arrow, the more common the result.

No information is encoded in the fact that some lines are solid and some are dashed. I've just done that in an attempt to improve legibility. (You can get a PDF of this diagram here, which should be a little easier to read.)

2010 - Grand Final Results 1.png

I've chosen not to amalgamate the records of Fitzroy and the Lions, Sydney and South Melbourne, or Footscray and the Dogs (though this last decision, I'll admit, is harder to detect). I have though amalgamated the records of North Melbourne and the Roos since, to my mind, the difference there is one of name only.

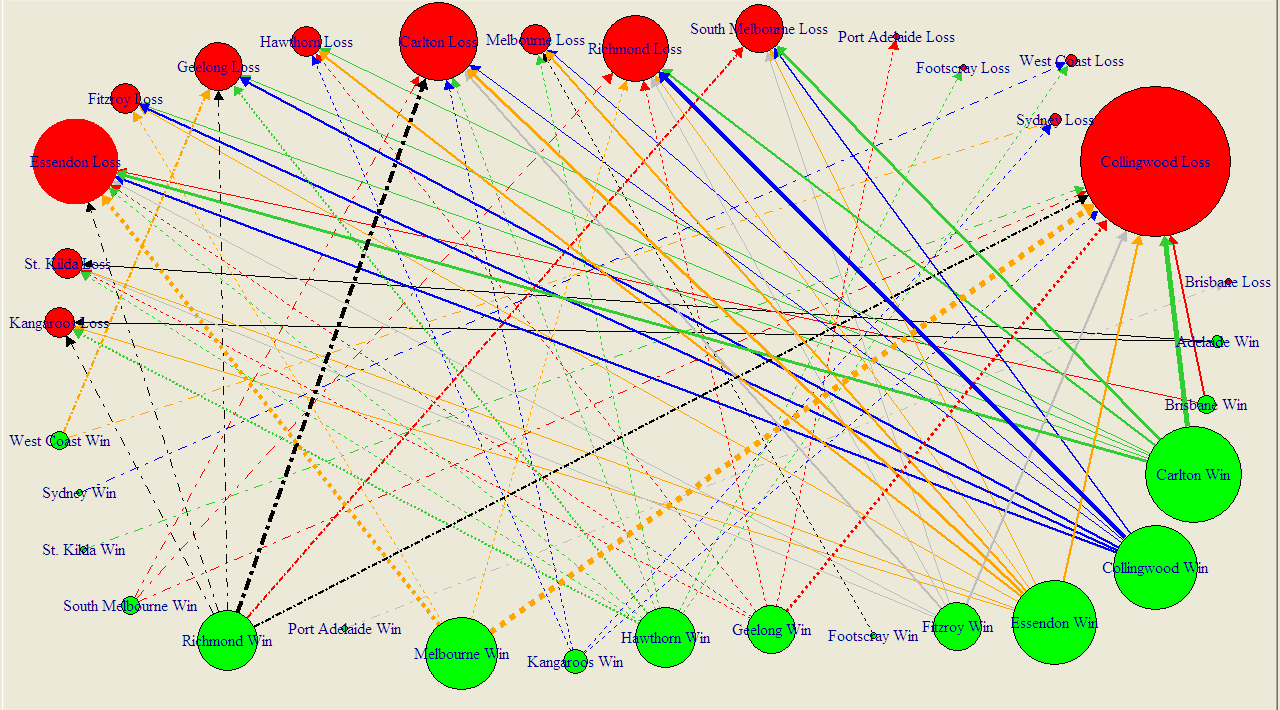
The diagram rewards scrutiny. I'll just leave you with a few things that stood out for me:

  • Seventeen different teams have been Grand Final winners; sixteen have been Grand Final losers
  • Wins have been slightly more equitably shared around than losses: eight teams have pea-sized or larger green circles (Carlton, Collingwood, Essendon, Hawthorn, Melbourne, Richmond, Geelong and Fitzroy), six have red circles of similar magnitude (Collingwood, South Melbourne, Richmond, Carlton, Geelong and Essendon).
  • I recognise that my vegetable-based metric is inherently imprecise and dependent on where you buy your produce and whether it's fresh or frozen, but I feel that my point still stands.
  • You can almost feel the pain radiating from those red circles for the Pies, Dons and Blues. Pies fans don't even have the salve of a green circle of anything approaching compensatory magnitude.
  • Many results are once-only results, with the notable exceptions being Richmond's dominance over the Blues, the Pies' over Richmond, and the Blues over the Pies (who knew - football Grand Final results are intransitive?), as well as Melbourne's over the Dons and the Pies.

As I write this, the Saints v Dogs game has yet to be played, so we don't know who'll face Collingwood in the Grand Final.

If it turns out to be a Pies v Dogs Grand Final then we'll have nothing to go on, since these two teams have not previously met in a Grand Final, not even if we allow Footscray to stand-in for the Dogs.

A Pies v Saints Grand Final is only slightly less unprecedented. They've met once before in a Grand Final when the Saints were victorious by one point in 1966.