Making History with VFL/AFL Final Scores

If the historical game data that I have is correct, we've gone very close to witnessing history this weekend, with the Hawthorn v Fremantle final score of 137-79 coming within a kick of finishing, instead, as a 131-79 win, or as a 138-79 win. Neither of these final scores were ever recorded in the 14,373 game history of the VFL/AFL between 1897 and 2013.

Read More

1897 to 2011 : Winners v Losers - Leads, Scoring Shots and Conversion

In the previous blog, among other things we analysed which quarter winning teams win. We might also ask about winnng teams, in what proportion of games do they trail at the end of a particular quarter, and how has this proportion tracked over the seasons.
Read More

Percentage of Points Scored in a Game

We statisticians spend a lot of our lives dealing with the bell-shaped statistical distribution known as the Normal or Gaussian distribution. It describes a variety of phenomena in areas as diverse as physics, biology, psychology and economics and is quite frankly the 'go-to' distribution for many statistical purposes.

So, it's nice to finally find a footy phenomenon that looks Normally distributed.

The statistic is the percentage of points scored by each team is a game and the distribution of this statistic is shown for the periods 1897 to 2008 and 1980 to 2008 in the diagram below.

Percent_of_Points_Scored.png

Both distributions follow a Normal distribution quite well except in two regards:

  1. They fall off to zero in the "tails" faster than they should. In other words, there are fewer games with extreme results such as Team A scoring 95% of the points and Team B only 5% than would be the case if the distribution were strictly normal.
  2. There's a "spike" around 50% (ie for very close and drawn games) suggesting that, when games are close, the respective teams play in such a way as to preserve the narrowness of the margin - protecting a lead rather than trying to score more points when narrowly in front and going all out for points when narrowly behind.

Knowledge of this fact is unlikely to make you wealthy but it does tell us that we should expect approximately:

  • About 1 game in 3 to finish with one team scoring about 55% or more of the points in the game
  • About 1 game in 4 to finish with one team scoring about 58% or more of the points in the game
  • About 1 game in 10 to finish with one team scoring about 65% or more of the points in the game
  • About 1 game in 20 to finish with one team scoring about 70% or more of the points in the game
  • About 1 game in 100 to finish with one team scoring about 78% or more of the points in the game
  • About 1 game in 1,000 to finish with one team scoring about 90% or more of the points in the game

The most recent occurrence of a team scoring about 90% of the points in a game was back in Round 15 of 1989 when Essendon 25.10 (160) defeated West Coast 1.12 (18).

We're overdue for another game with this sort of lopsided result.

Winners' Share of Scoring

You might recall from seasons past my commenting on what I've claimed to be a startling regularity in AFL scoring, specifically, the proportion of scoring shots recorded by winning teams.

In 2008, winning teams racked up 57.3% of all scoring shots, while in 2007 the figure was 56.6%, and in 2006 it was 56.7%. Across the period 1999 to 2008 this percentage bounced around in a range between 56.4% and 57.8%. By any standard that's remarkable regularity.

I've recently come into possession of the scores for the entire history of the VFL/AFL competition in a readily analysable form - and by now you surely now how dangerous that's gotta be - so it seemed only natural to see if this regularity persisted into earlier seasons (assuming that it makes sense for something to persist into the past).

Below is a chart showing (in purple) the percentage of scoring shots registered by winning teams in each of the seasons 1897 through 2008. (The red line shows the proportion of goals that they scored, and the green line shows the proportion of behinds.)

Winners_Scoring.png

So, apart from the more extreme dominance of winning teams in the first decade or so of the competition, and a few other aberrant seasons over the next two decades, we have certainly seen remarkable stability in the percentage we've been discussing. Indeed, in the period 1927 to 2008, the percentage of scoring shots registered by winning teams has never been outside the range 55.0% to 59.6%. That surely almost establishes this phenomenon as a Law of Footy.

For those of you who prefer to digest your data in tabular form (preferably taken with meals), here's a decade-by-decade summary of the data.

Winners_Scoring_Table.png

The recent peak in winning teams' share of scoring was witnessed in 1995 and it came not as a consequence of a spike in 6-pointer dominance but instead from a spike in winning teams' share of behinds. In 1995 winning teams scored 57% of all behinds, which is about 2-4% higher than anything we've witnessed since. 1995 was the year that Carlton won the minor premiership kicking 317 behinds, Geelong finished runners-up kicking 338, and Richmond and Essendon, finishing in 3rd and 4th, kicked 600 more between them. By way of context, that's almost 75 more behinds than the top 4 of Geelong, Hawthorn, Western Bulldogs and St Kilda managed in 2008.

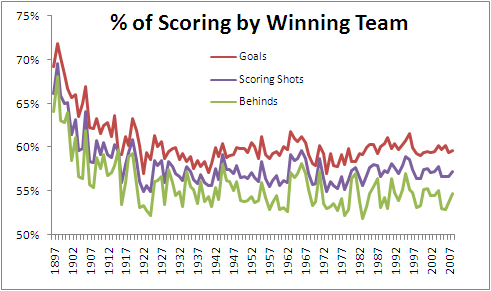
Regularity also aptly describes the history of the percentage of goals kicked by winning teams across the seasons (the red line in the chart). Again looking at the entire period since 1927, this percentage has never strayed from the righteous range of 57.0% to 61.8%.

Winning teams' share of behinds (the green line) has been, relatively speaking, quite variable, ranging from 51.9% to 58.2% in the period 1927 to the present, which once again demonstrates that it's goals and not behinds that win footy games.