And the Best and Worst VFL/AFL Teams of All-Time Are ...
/I've promised for a while now to create MARS Ratings for the entire history of the VFL/AFL and with some time away from home over Easter, I'm now able to deliver on that promise.
CHOOSING THE MARS PARAMETERS
MARS Ratings, you might recall, are ELO-based and require us to choose a number of parameters that determine how specific game results alter the Ratings of the teams involved. The parameters that I currently use were selected to optimise the predictive accuracy of Ratings over recent seasons, so there's no guarantee that they'll be optimal in any sense as we attempt to rate teams across the period from 1897.
It turns out though that, based on cross-fold validation (using the lmCV function from the chemometrics package in R) of models fitted to home-team victory margins, the current parameter set fares pretty well across the entirety of VFL/AFL history in comparison with other parameter sets, selected broadly at random, whose performance I also assessed in the same way.
To be a little tangible about this, the current set of MARS parameters are as follows:
- Margin Cap : 78
- Home Ground Adjustment : - 6
- Multiplier : 37.5
- Divisor 1 : 130
- Divisor 2 : 550
- Season-to-Season Carry-over : 47%
- Initial Rating for New Teams : 1,000
(Note that the choice of an Initial Rating for all new teams of 1,000 differs from what I used for GWS in 2012 where I set the Initial Rating to 925.)
The next-best set of parameters that I uncovered in my search for superior MARS Ratings had:
- Margin Cap : 73
- Home Ground Adjustment : +17
- Multiplier : 97
- Divisor 1 : 118
- Divisor 2 : 676
- Season-to-Season Carry-over : 58.5%
- Initial Rating for New Teams : 1,000 (note that I did not vary this experimentally).
This set of parameters did predict results, margins and game probabilities slightly better across the entire history of VFL/AFL than the incumbent set of parameters, but the improvements were small and tended to be greatest for seasons in the distant past, on the basis of which I've opted to stick with the current parameters to derive historical MARS Ratings. (In any case, the correlation between the Ratings produced by the two sets of parameters is +0.98 so, in practice, it means little whether we choose one set or the other.)
MARS RATINGS AS GAME OUTCOME PREDICTORS
The MARS Ratings produced using the selected parameters can be used to create two predictive models:
- A binary logit to predict the winner of each game
- An OLS model to predict the home team's victory margin (I have, by the way, used the AFL-designation to determine which team was playing at home and which was playing away, regardless of venue.)
Fitting models across the entirety of VFL/AFL history yields:
- ln(Prob(Home Team Wins)/(1-Prob(Home Team Wins)) = -5.366 + 0.04324 x Home Team MARS Rating - 0.03739 x Away Team MARS Rating
- Home Team Victory Margin = -23.342 + 0.76582 x Home Team MARS Rating - 0.73367 x Away Team MARS Rating (R-Squared = 27.2%)
When we apply these models to the actual results for each of the seasons 1897 to 2012, we obtain:

On average, across the 116 completed seasons, using the first model (with a 50% threshold) to predict which team will win, we'd have been correct in over 70% of games (as per the red line). It's true that this proportion has been lower in more-recent times, but it's still been around 66%, which means that a model fitted to the entirety of VFL/AFL history, using MARS Ratings derived from a single set of parameters for the entire century-and-a-bit, is good enough to predict the result of two games in three in the modern era.
The blue line tracks the season-by-season mean absolute prediction error (MAPE) and shows higher values since about 1980. This might be due to an inherently greater level of unpredictability in margins since that time or might instead signal some sort of structural change in the game that requires a different home team margin model to be estimated for the current era. Regardless, the model's all-season MAPE of 26.52 points per game, and its MAPE of 31.48 points per game across the period 1980-2012 seems entirely satisfactory.
We can also assess the efficacy of the probability predictions produced using the second model above in terms of the season-by-season average Brier Score of 1+Log Probability Score.


Recall that lower Brier Scores and higher Log Probability Scores are better, so we can see that the general trend has been for the probabilities from the model derived from MARS Ratings to be a little less reliable as seasons have passed since about 1950, though they've been more reliable, relatively speaking in 2011 and 2012.
On balance, I think it's fair to say that the MARS Ratings and the statistical models derived using them as inputs, are acceptably accurate predictors of game outcomes across the 116 seasons of VFL/AFL.
TEAM-BY-TEAM MARS RATING HISTORY
Having chosen the parameters to use in the MARS Rating System, the last thing I needed to do was to decide how to treat teams as their names changed or as they merged. This is important because teams carry over a portion of their Ratings from one season to the next. What I eventually decided was:
- That Brisbane and the Brisbane Lions should be treated as the same team
- That Fitzroy should be treated as a single team that ceased to exist in 1996
- That South Melbourne, Sydney and the Sydney Swans should be treated as the same team
- That North Melbourne and the Kangaroos should be treated as the same team
- That Footscray and the Western Bulldogs should be treated as the same team
Given all that, here's the Ratings history of every team for the entire history of the VFL/AFL:
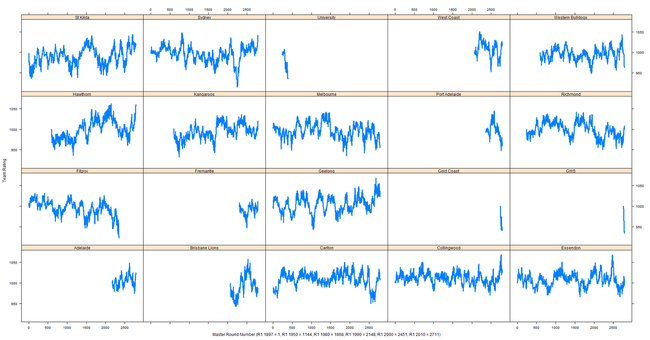
In the X-axis label I've provided some information that will help you to link Master Round numbers to points in time. For example, the 1st round of the 2000 season corresponds to an X-axis value of 2,451.
HIGHS AND LOWS
Interested readers will I'm sure make their own observations about the Ratings time-series in the previous chart, and in future blogs I'll be returning to review particular aspects of what's here, but for this blog I want to focus on the broader issues of all-time bests and worsts.
In doing that I'll note that the nature of MARS Ratings, in particular the fact that teams' Ratings are reset at the beginning of every season to move them closer to the average Rating of 1,000, means that any given team's ability to achieve record high or low Ratings in a season is somewhat constrained by the number of games it played in that season.
Accordingly, I've tabulated the record high and low Ratings on the basis of the number of games that a team played in the relevant season:

So, for example, the first row shows that the highest MARS Rating attained by any team that played only 13 games in a season was recorded by Collingwood in 1916. During that season it reached a peak Rating of 1,014.7. In comparison, the lowest Rating attained by any team playing only 13 games in a season was recorded by Richmond, also in 1916, when it bottomed out at a Rating of 989.9.
The entries shaded grey are the all-time records. The Essendon team of 2000, therefore, has the highest recorded MARS Rating of 1,071.8, which it reached at the end of the Grand Final of that year. They are then, according to MARS, the Greatest Team in VFL/AFL history.
Fitzroy's 1996 team hold the less-welcome record of being the Worst Team in VFL/AFL history, having troughed at a MARS Rating of 913.6 at the end of the 1996 season, shortly before the team winked out of existence.
(Though not included in the table above, the Roos of 1977 are the only team to have played 27 games in a single season. Their season was extended by their participation in the tied Grand Final of that year. Their lowest Rating during 1977 was 1,014.2 and their highest was 1,029.7.)
Next, ignoring season-length, we consider the highest and lowest Ratings achieved by every team across their respective histories.

It's interesting to note that, despite their extended histories in the competition, none of Fitzroy, the Roos/North Melbourne, Melbourne, Richmond, St Kilda, or the Western Bulldogs / Footscray have ever achieved Ratings above 1,050.
As well, Fremantle's peak Rating is quite low at just 1,019.5, but is still considerably higher than the Suns' and the Giants'. (Note that Ratings are assessed at the end of each round so that while both the Suns and the Giants started their respective inaugural seasons with Ratings of 1,000, their first-up losses were significant enough to knock 6-7 points off their Ratings.)
Adelaide, currently, has the highest minimum Rating, having never fallen below 974.6. Next best is Collingwood, who have preserved a Rating of 969.7 or higher for their entire, extended history.
The Dons' 966.4 is third-best ahead of West Coast's 951.6.
We already know that Fitzroy holds the all-time record for lowest MARS Rating. The team with the next-worst all-time low Rating is Sydney / South Melbourne who were Rated just 915.7 as recently as 1993. The third-worst all-time low Rating belongs to the Saints with a Rating of 930.1.
WRAP UP
For now that'll do. More in future blogs.
