1897 to 2011 : Goals, Behinds, Scoring Accuracy & Winning Team Results By Quarter
/We've looked before at the topic of which quarter winning teams win. Today, first up, we'll revisit this issue in more depth.
(As per MAFL custom, please click on any images in this blog for larger versions.)

Each line in the chart represents, for every VFL/AFL season in history, the percentage of 1st, 2nd, 3rd or 4th quarters won by the team that eventually went on to win the game (drawn games have been excluded, and drawn quarters have been treated as half-wins).
One immediately obvious feature of this chart is the relatively lower proportion of 1st quarters, compared to other quarters, won by winning teams, especially in recent seasons. In only 6 of the last 40 completed seasons have winning teams won more 1st quarters in the season than did any other quarter.
In contrast, the much higher frequency with which winning teams have won 4th and, especially, 3rd quarters is apparent. In some seasons, winning teams have won as much as 80% of 3rd terms.
The stark differences in the relative frequencies with which winning teams have won different quarters is demonstrated in the following table, which presents the same information shown in the chart after grouping contiguous seasons into 12-year eras. Since about the mid-1950s we can see that the 3rd quarter has generally been the crucial quarter.

Results for the current season are also in this table and show quarter 1 as having been a much better indicator of the eventual game result so far this season than is normally the case. They also show a strong correlation between 3rd quarter results and the eventual outcome, and an abnormally low rate of games where the eventual winner has outscored its opponent in the final term.
One possible reason for the lesser importance of final terms this season has been the atypically small proportion of goal-scoring that's taken place in this quarter.

Should the season finish with only 23.6% of all goals having been scored in the final term, this will represent the lowest proportion of final-term goals for over 80 years.

The earlier table also provides an insight into why the 3rd quarter has, in contrast to the 4th, been so pivotal this season, with 26.4% of all goals coming in this quarter. This is also an historically extreme proportion that, if continued, would place this season amongst the top half-dozen in VFL/AFL history.
Looking at total scoring shots rather than goals alone provides a broadly similar if less dramatic historical picture.

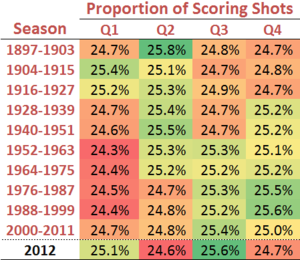
Whilst the proportion of scoring shots has, to within a percent or so, tended to be equal across the four quarters across eras and even within whole seasons, the number of scoring shots in each quarter has shown far more variability over time, and has been trending downwards for about the last 30 years in every quarter and, consequently, in total.

A larger proportion of this decline has come from a reduction in the number of behinds than in the number of goals, however, as the following table shows.

The most recent era, 2000-2011, has seen about 2 goals fewer per game than the 1976-87 era, but about 4.5 fewer behinds. This season, so far, has had about 1-and-a-half goals fewer per game than the 2000-2011 average, and about one-half a behind more.
With more goals and fewer behinds, goal scoring accuracy (or conversion as I've termed it in the Team Dashboards) has consequently been rising, a trend which is even more apparent in the following chart.

There is, though, some suggestion that accuracy rates are levelling off or perhaps even in a slight decline.
