Predicting Margins Using Market Prices and MARS Ratings

Imagine that you allowed me to ask you for just one piece of data about an upcoming AFL game. Armed with that single piece of data I contend that I will predict the margin of that game and, on average, be within 5 goals of the actual margin. Further, one-half of the time I'll be within 4 goals of the final margin and one-third of the time I'll be within 3 goals. What piece of data do you think I am going to ask you for?

I'll ask you for the bookies' price for the home team, true or notional, I'll plug that piece of data into this equation:

Predicted Margin = -49.17 + 96.31 x (1 / Home Team Price)

(A positive margin means that the Home Team is predicted to win, a negative margin that the Away Team is predicted to win. So, at a Home Team price of $1.95 the Home Team is predicted to win; at $1.96 the Away Team is predicted to squeak home.)

Over the period 2006 to 2009 this simple equation has performed as I described in the opening paragraph and explains 23.6% of the variability in the victory margins across games.

Here's a chart showing the performance of this equation across seasons 2006 to 2009.

2010 Predicted v Actual Margin.png

The red line shows the margin predicted by the formula and the crosses show the actual results for each game. You can see that the crosses are fairly well described by the line, though the crosses are dense in the $1.50 to $2.00 range, so here's a chart showing only those games with a home team price of $4 or less.

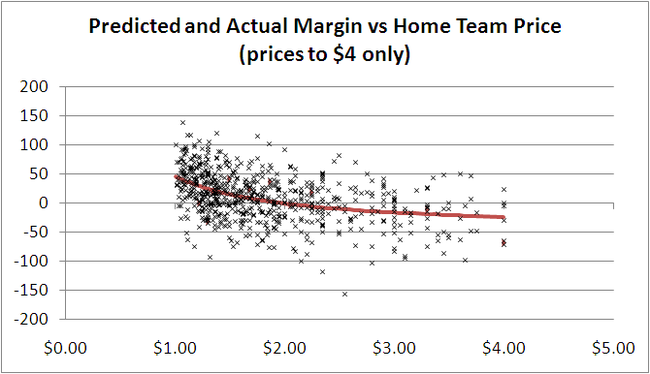
How extraordinary to find a model so parsimonious yet so predictive. Those bookies do know a thing or two, don't they?

Now what if I was prohibited from asking you for any bookie-related data but, as a trade-off, was allowed two pieces of data rather than one? Well, then I'd be asking you for my MARS Ratings of the teams involved (though quite why you'd have my Ratings and I'd need to ask you for them spoils the narrative a mite).

The equation I'd use then would be the following:

Predicted Margin = -69.79 + 0.779 x MARS Rating of Home Team - 0.702 x MARS Rating of Away Team

Switching from the bookies' brains to my MARS' mindless maths makes surprisingly little difference. Indeed, depending on your criterion, the MARS Model might even be considered superior, your Honour.

The prosecution would point out that the MARS Model explains about 1.5% less of the overall variability in victory margins, but the case for the defence would counter that it predicts margins that are within 6 points of the actual margin over 15% of the time, more than 1.5% more often than the bookies' model does, and would also avow that the MARS model predictions are 6 goals or more different from the actual margin less often than are the predictions from the bookies' model.

So, if you're looking for a model that better fits the entire set of data, then percent of variability explained is your metric and the bookies' model is your winner. If, instead, you want a model that's more often very close to the true margin and less often very distant from it, then the MARS Model rules.

Once again we have a situation where a mathematical model, with no knowledge of player ins and outs, no knowledge of matchups or player form or player scandals, with nothing but a preternatural recollection of previous results, performs at a level around or even above that of an AFL-obsessed market-maker.

A concept often used in modelling is that of information. In the current context we can say that a bookie's home team price contains information about the likely victory margin. We can also say that my MARS ratings have information about likely victory margins too. One interesting question is does the bookie's price have essentially the same information as my MARS ratings or is there some additional information content in their combination?

To find out we fit a model using all three variables - the Home Team price, the Home Team MARS Rating, and the Away Team MARS Rating - and we find that all three variables are statistically significant at the 10% level. On that basis we can claim that all three variables contain some unique information that helps to explain a game's victory margin.

The model we get, which I'll call the Combined Model, is:

Predicted Margin = -115.63 + 67.02 / Home Team Price + 0.31 x MARS Rating of Home Team - 0.22 x MARS Rating of Away Team

A summary of this model and the two we covered earlier appears in the following table:

2010 Bookies v MARS.png

The Combined Model - the one that uses the bookie price and MARS ratings - explains over 24% of the variability in victory margin and has an average absolute prediction error of just 29.2 points. It produces these more accurate predictions not by being very close to the actual margin more often - in fact, it's within 6 points of the actual margin only about 13% of the time - but, instead, by being a long way from the actual margin less often.

Its margin prognostications are sufficiently accurate that, based on them, the winning team on handicap betting is identified a little over 53% of the time. Of course, it's one thing to fit a dataset that well and another thing entirely to convert that performance into profitable forecasts.

The Draw's Unbalanced: So What?

In an earlier blog we looked at how each team had fared in the 2010 draw and assessed the relative difficulty of each team's draw by, somewhat crudely, estimating a (weighted) average MARS of the teams they played. From the point of view of the competition ladder, however, what matters is not the differences in the average MARS rating of the teams played, but how these differences, on a game-by-game basis, translate into expected competition points.
Read More

A Place (or Places) To Call Home

It's that time of year again when we need to ruminate over the draw and decide which team, if either, is really the home team for each game. This year these decisions are even more complex than they usually are since, according to the AFL's official home team designations, 8 teams have two home grounds and 2 more have three home grounds across the season. The nomadic teams include 4 that play only a single game at one of their designated home grounds. I don't think it makes sense to designate a venue as home for a team if that team's players would, unaccompanied by team management, need to ask directions to find it.
Read More

Gotta Have Momentum

Momentum, footy commentators will assert at least a few dozen times a season, is vital. When a team has it they string passes together, goals together, quarters together, wins together, maybe even flags together; when they don't, well they don't string much together at all except excuses. So, I wondered, what might momentum look like, which teams seem to display it and which don't?
Read More

Grand Final Typology

Today's blog looks at the typology of AFL Grand Finals. There are, it turns out, five basic types: (1) The Coast-to-Coast Coasting victory (2) The Come-From-Behind victory (3) The Game-of-Two-Halves Victory (4) The Coast-to-Coast Blowout Victory (5) The Nervous Start Victory
Read More

Grand Finals: Points Scoring and Margins

How would you characterise the Grand Finals that you've witnessed? As low-scoring, closely fought games; as high-scoring games with regular blow-out finishes; or as something else?

First let's look at the total points scored in Grand Finals relative to the average points scored per game in the season that immediately preceded them.

GF_PPG.png

Apart from a period spanning about the first 25 years of the competition, during which Grand Finals tended to be lower-scoring affairs than the matches that took place leading up to them, Grand Finals have been about as likely to produce more points than the season average as to produce fewer points.

One way to demonstrate this is to group and summarise the Grand Finals and non-Grand Finals by the decade in which they occurred.

GF_PPG_CHT.png

There's no real justification then, it seems, in characterising them as dour affairs.

That said, there have been a number of Grand Finals that failed to produce more than 150 points between the two sides - 49 overall, but only 3 of the last 30. The most recent of these was the 2005 Grand Final in which Sydney's 8.10 (58) was just good enough to trump the Eagles' 7.12 (54). Low-scoring, sure, but the sort of game for which the cliche "modern-day classic" was coined.

To find the lowest-scoring Grand Final of all time you'd need to wander back to 1927 when Collingwood 2.13 (25) out-yawned Richmond 1.7 (13). Collingwood, with efficiency in mind, got all of its goal-scoring out of the way by the main break, kicking 2.6 (20) in the first half. Richmond, instead, left something in the tank, going into the main break at 0.4 (4) before unleashing a devastating but ultimately unsuccessful 1.3 (9) scoring flurry in the second half.

That's 23 scoring shots combined, only 3 of them goals, comprising 12 scoring shots in the first half and 11 in the second. You could see that many in an under 10s soccer game most weekends.

Forty-five years later, in 1972, Carlton and Richmond produced the highest-scoring Grand Final so far. In that game, Carlton 28.9 (177) held off a fast-finishing Richmond 22.18 (150), with Richmond kicking 7.3 (45) to Carlton's 3.0 (18) in the final term.

Just a few weeks earlier these same teams had played out an 8.13 (63) to 8.13 (63) draw in their Semi Final. In the replay Richmond prevailed 15.20 (110) to Carlton's 9.15 (69) meaning that, combined, the two Semi Finals they played generated 22 points fewer than did the Grand Final.

From total points we turn to victory margins.

Here too, again save for a period spanning about the first 35 years of the competition during which GFs tended to be closer fought than the average games that had gone before them, Grand Finals have been about as likely to be won by a margin smaller than the season average as to be won by a greater margin.

GF_MPG.png

Of the 10 most recent Grand Finals, 5 have produced margins smaller than the season average and 5 have produced greater margins.

Perhaps a better view of the history of Grand Final margins is produced by looking at the actual margins rather than the margins relative to the season average. This next table looks at the actual margins of victory in Grand Finals summarised by decade.

GF_MOV.png

One feature of this table is the scarcity of close finishes in Grand Finals of the 1980s, 1990s and 2000s. Only 4 of these Grand Finals have produced a victory margin of less than 3 goals. In fact, 19 of the 29 Grand Finals have been won by 5 goals or more.

An interesting way to put this period of generally one-sided Grand Finals into historical perspective is provided by this, the final graphic for today.

GF_MOV_PC.png

They just don't make close Grand Finals like they used to.

A First Look at Grand Final History

In Preliminary Finals since 2000 teams finishing in ladder position 1 are now 3-0 over teams finishing 3rd, and teams finishing in ladder position 2 are 5-0 over teams finishing 4th.

Overall in Preliminary Finals, teams finishing in 1st now have a 70% record, teams finishing 2nd an 80% record, teams finishing 3rd a 38% record, and teams finishing 4th a measly 20% record. This generally poor showing by teams from 3rd and 4th has meant that we've had at least 1 of the top 2 teams in every Grand Final since 2000.

Finals_Summary_Wk3.png

Reviewing the middle table in the diagram above we see that there have been 4 Grand Finals since 2000 involving the teams from 1st and 2nd on the ladder and these contests have been split 2 apiece. No other pairing has occurred with a greater frequency.

Two of these top-of-the-table clashes have come in the last 2 seasons, with 1st-placed Geelong defeating 2nd-placed Port Adelaide in 2007, and 2nd-placed Hawthorn toppling 1st-placed Geelong last season. Prior to that we need to go back firstly to 2004, when 1st-placed Port Adelaide defeated 2nd-placed Brisbane Lions, and then to 2001 when 1st-placed Essendon surrendered to 2nd-placed Brisbane Lions.

Ignoring the replays of 1948 and 1977 there have been 110 Grand Finals in the 113-year history of the VFL/AFL history, with Grand Finals not being used in the 1897 or 1924 seasons. The pairings and win-loss records for each are shown in the table below.

GF_Records.png

As you can see, this is the first season that St Kilda have met Geelong in the Grand Final. Neither team has been what you'd call a regular fixture at the G come Grand Final Day, though the Cats can lay claim to having been there more often (15 times to the Saints' 5) and to having a better win-loss percentage (47% to the Saints' 20%).

After next weekend the Cats will move ahead of Hawthorn into outright 7th in terms of number of GF appearances. Even if they win, however, they'll still trail the Hawks by 2 in terms of number of Flags.

What Price the Saints to Beat the Cats in the GF?

If the Grand Final were to be played this weekend, what prices would be on offer?

We can answer this question for the TAB Sportsbet bookie using his prices for this week's games, his prices for the Flag market and a little knowledge of probability.

Consider, for example, what must happen for the Saints to win the flag. They must beat the Dogs this weekend and then beat whichever of the Cats or the Pies wins the other Preliminary Final. So, there are two mutually exclusive ways for them to win the Flag.

In terms of probabilities, we can write this as:

Prob(St Kilda Wins Flag) =

Prob(St Kilda Beats Bulldogs) x Prob (Geelong Beats Collingwood) x Prob(St Kilda Beats Geelong) +

Prob(St Kilda Beats Bulldogs) x Prob (Collingwood Beats Geelong) x Prob(St Kilda Beats Collingwood)

We can write three more equations like this, one for each of the other three Preliminary Finalists.

Now if we assume that the bookie's overround has been applied to each team equally then we can, firstly, calculate the bookie's probability of each team winning the Flag based on the current Flag market prices which are St Kilda $2.40; Geelong $2.50; Collingwood $5.50; and Bulldogs $7.50.

If we do this, we obtain:

  • Prob(St Kilda Wins Flag) = 36.8%
  • Prob(Geelong Wins Flag) = 35.3%
  • Prob(Collingwood Wins Flag) = 16.1%
  • Prob(Bulldogs Win Flag) = 11.8%

Next, from the current head-to-head prices for this week's games, again assuming equally applied overround, we can calculate the following probabilities:

  • Prob(St Kilda Beats Bulldogs) = 70.3%
  • Prob(Geelong Beats Collingwood) = 67.8%

Armed with those probabilities and the four equations of the form of the one above in bold we come up with a set of four equations in four unknowns, the unknowns being the implicit bookie probabilities for all the possible Grand Final matchups.

To lapse into the technical side of things for a second, we have a system of equations Ax = b that we want to solve for x. But, it turns out, the A matrix is rank-deficient. Mathematically this means that there are an infinite number of solutions for x; practically it means that we need to define one of the probabilities in x and we can then solve for the remainder.

Which probability should we choose?

I feel most confident about setting a probability - or a range of probabilities - for a St Kilda v Geelong Grand Final. St Kilda surely would be slight favourites, so let's solve the equations for Prob(St Kilda Beats Geelong) equal to 51% to 57%.

Each column of the table above provides a different solution and is obtained by setting the probability in the top row and then solving the equations to obtain the remaining probabilities.

The solutions in the first 5 columns all have the same characteristic, namely that the Saints are considered more likely to beat the Cats than they are to beat the Pies. To steal a line from Get Smart, I find that hard to believe, Max.

Inevitably then we're drawn to the last two columns of the table, which I've shaded in gray. Either of these solutions, I'd contend, are valid possibilities for the TAB Sportsbet bookie's true current Grand Final matchup probabilities.

If we turn these probabilities into prices, add a 6.5% overround to each, and then round up or down as appropriate, this gives us the following Grand Final matchup prices.

St Kilda v Geelong

  • $1.80/$1.95 or $1.85/$1.90

St Kilda v Collingwood

  • $1.75/$2.00 or $1.70/$2.10

Geelong v Bulldogs

  • $1.50/$2.45 or $1.60/$2.30

Collingwood v Bulldogs

  • $1.65/$2.20 or $1.50/$2.45

MARS Ratings of the Finalists

We've had a cracking finals series so far and there's the prospect of even better to come. Two matches that stand out from what we've already witnessed are the Lions v Carlton and Collingwood v Adelaide games. A quick look at the Round 22 MARS ratings of these teams tells us just how evenly matched they were.

MARS_Finalists_F2.png

Glancing down to the bottom of the 2009 column tells us a bit more about the quality of this year's finalists.

As a group, their average rating is 1,020.8, which is the 3rd highest average rating since season 2000, behind only the averages for 2001 and 2003, and weighed down by the sub-1000 rating of the eighth-placed Dons.

At the top of the 8, the quality really stands out. The top 4 teams have the highest average rating for any season since 2000, and the top 5 teams are all rated 1,025 or higher, a characteristic also unique to 2009.

Someone from among that upper eschelon had to go out in the first 2 weeks and, as we now know, it was Adelaide, making them the highest MARS rated team to finish fifth at the end of the season.

MARS_Finalists_F2_2.png

(Adelaide aren't as unlucky as the Carlton side of 2001, however, who finished 6th with a MARS Rating of 1,037.9)

Updated Finals Summary

There's been a pleasing neatness to the results of the finals so far, depicted below.

Close inspection will reveal that Week 1 saw the teams from ladder positions 7 and 8 knocked out and Week 2 left those fans of the teams from positions 5 and 6 with other things to do for the rest of September. Which, of course, leaves the teams from ladder spots 1 through 4 to contest for a ticket to the Granny. All very much as it should be.

The phenomenon of the top 4 teams playing off in the Prelims has been witnessed in every season since we've had the current finals system, bar 2001 and 2007 when, in both cases, the team from 6th took the place of the team from 3rd.

The Week 2 Semi-Finals have been footballing graveyards for the teams in the bottom half of the eight, as shown in the table below.

Teams from 5th have won only 4 of 10 Elimination Finals, while teams from 8th have won the other 6. None of the winning teams have proceeded beyond the Semis.

Teams from 7th have only survived into the second week once, and this victor proceeded no further than the second week, while teams from 6th have reached the Semis on 9 occasions, losing 7 and winning just 2.

The summary of performance by ladder position across all weeks of the finals now looks like this:

Overall, teams finishing 7th have the worst finals record, winning only 1 from 11 (9%). Teams from 3rd, 4th, 5th and 8th all also have sub-50% records.

Teams finishing 6th have an 11 and 10 record, though 9 of those 11 wins have come in the Elimination Final.

And, as you might expect, teams from 1st and 2nd have the best records. Teams from 1st position have an overall 20 and 9 (69%) record, and a 10 and 5 (67%) record for the last 2 weeks of the finals. Teams from 2nd position have a slightly better overall record of 20 and 7 (74%) but a slightly worse record of 10 and 6 (63%) across the last two weeks of the finals.

Looking ahead to Week 3 of the finals I can tell you that teams from 1st have a perfect 2-0 record against teams from 3rd, and teams from 2nd have an equally perfect 4-0 record against teams from 4th.

The Life We Might Have Led

Though I doubt many of you are mourning the loss of the Funds that operated last year, I know I was curious to see how they would have performed had I allowed them to run around for another season.

Let me start with a comparison of last year's Recommended Portfolio with this year's:

Starting with the obvious, Investors would have been happier at this point of the season - up by 22% rather than 10% - had last year's Funds and weightings been in force to create the Recommended Portfolio this year.

They'd not, however, have been in this state for all of the season, just for a period from the first game of Round 7, when Essendon beat Hawthorn and paid $5, to the first game of Round 11, and then again from the last game of Round 20, when Essendon toppled St Kilda and paid $6.50, to the present.

Interspersed with the periods of euphoria would have been long periods of despair as the Fund dropped to 80% of its value on two occasions before rebounding to its current levels. The fluctuations in the value of the 2008 Recommended Portfolio encompass a trough of almost -20% at the end of Round 8 to a peak of almost 30% at the end of Round 20. This range of about 50% contrasts starkly with that produced by this year's Recommended Portfolio, which is a range a touch less than half that amount and which includes a low point of only about -5%.

It'll be no surprise to anyone that the major cause of the dramatic fluctuations in the performance of the 2008 Recommended Portfolio would have been the Heritage Fund. In the chart below I've mapped its performance against that of the New Heritage Fund.

Pay close attention to the y-axis on this chart. The Heritage Fund peaks in value early in the season, climbing to +63% on the back of a lucrative wager on Freo at $3.75 who knocked off the Blues at Gold Coast Stadium, before plummeting to -69% at the end of Round 12 after a series of large and unsuccessful wagers, thereafter recovering, plummeting again and then climbing to a peak of +28% after the first game of Round 21, one game after landing the Dons at $6.50.

Also contributing to the superior performance of the 2008 Recommended Portfolio is the extraordinary success of last year's Line Fund compared to Line Redux.

The impressive result for the Line Fund has been achieved on the basis of just 29 wagers, 19 of them successful. Line Redux, by comparison, has eked out its profit on the back of 70 wagers with just 37 of them successful, a scant 2 wins better than chance.

Last year's Chi Fund has also performed better than this year's Chi-squared - well, more accurately, it's performed less worse. It has even, albeit briefly, drifted into profit.

Amongst the remaining Funds, Hope has outshone them all, though Alpha and Beta have also produced solid gains. Prudence has generated consistent if unspectacular profits.


A Decade of Finals

This year represents the 10th under the current system of finals, a system I think has much to recommend it. It certainly seems to - justifiably, I'd argue - favour those teams that have proven their credentials across the entire season.

The table below shows how the finals have played out over the 10 years:

Finals_2009_W1.png

This next table summarises, on a one-week-of-the-finals-at-a-time basis, how teams from each ladder position have fared:

Finals_Summary_Wk1.png

Of particular note in relation to Week 1 of the finals is the performance of teams finishing 3rd and of those finishing 7th. Only two such teams - one from 3rd and one from 7th - have been successful in their respective Qualifying and Elimination Finals.

In the matchups of 1st v 4th and 5th v 8th the outcomes have been far more balanced. In the 1st v 4th clashes, it's been the higher ranked team that has prevailed on 6 of 10 occasions, whereas in the 5th v 8th clashes, it's been the lower ranked team that's won 60% of the time.

Turning our attention next to Week 2 of the finals, we find that the news isn't great for Adelaide or Lions fans. On both those occasions when 4th has met 5th in Week 2, the team from 4th on the ladder has emerged victorious, and on the 7 occasions that 3rd has faced 6th in Week 2, the team from 3rd on the ladder has won 5 and lost only 2.

Looking more generally at the finals, it's interesting to note that no team from ladder positions 5, 7 or 8 has made it through to the Preliminary Finals and, on the only two occasions that the team from position 6 has made it that far, none has progressed into the Grand Final.

So, teams only from positions 1 to 4 have so far contested Grand Finals, teams from 1st on 6 occasions, teams from 2nd on 7 occasions, teams from 3rd on 3 occasions, and teams from 4th only twice.

No team finishing lower than 3rd has yet won a Flag.

When Finalists Meet

If the teams in the finals are the best teams in the competition (and the MARS ratings say otherwise, but nonetheless) then it seems to make sense to focus on the games in which they've faced off in assessing each team's relative chances. The tables below have been constructed including just those games.

The first table provides the aggregate record of each team:

I'll come back and analyse this some more in a moment, but let me note a couple of interesting things here in passing:

  • Only 3 teams have a Percentage better than 100, and the third of them - the Dogs - only barely qualifies
  • The top 3 teams - on the ladder I've constructed here and on the competition ladder proper - met other teams in the final 8 on the fewest occasions - just 10 times each.

The second table provides summary information on the team matchups:

Now, looking at both tables together, let's consider the records of each team.

St Kilda

  • Have by far the best combined record against the other finalists, losing just 1 of 10 ten games, to the Dons in R20
  • Rank 1st on Points For and on Points Against
  • Have a Percentage almost 25 points better than any other team
  • Faced only 1 finalist in the last 5 rounds of the season

Geelong

  • Have the 2nd best combined record but it is only 6 and 4.
  • Faced 5 finalists in the second half of the season and lost 4 of them
  • Rank 2nd on Points For and 3rd on Points Against
  • Faced 3 finalists in the last 5 rounds of the season, winning 1 and losing 2
  • Have a 2 and 2 record against teams in the top 4

Western Bulldogs

  • Have a 5 and 5 record and, roughly, a Percentage of 100
  • Rank 3rd on Points For and 5th on Points Against
  • Faced only 4 finalists in the 1st half of the season, winning 1 and losing 3
  • Faced 6 finalists in the 2nd half of the season, winning 4 and losing 2
  • Faced finalists in all of the last 3 rounds and defeated them all
  • Have an 0 and 2 record against St Kilda
  • Have a 2 and 4 record against teams in the top 4

Collingwood

  • Have a 6 and 6 record and a Percentage just under 100
  • Are the only team to face 4 of the other finalists twice each
  • Rank 8th on Points For but 2nd on Points Against
  • Went 1 and 5 in the 1st half of the season, and 5 and 1 in the 2nd half
  • Faced 4 finalists in the last 6 rounds of the season, winning the first 3 - in a row, as it happpens - but losing the fourth.
  • Have a 1 and 3 record against teams in the top 4

Carlton

  • Have a 5 and 6 record and a Percentage around 90
  • Rank 4th on Points For but 8th on Points Against
  • Went 4 and 2 in the 1st half of the season, and 1 and 4 in the 2nd half
  • Faced only 3 finalists in the last 9 rounds of the season, winning only 1 of those contests
  • Have 0 and 2 records against Essendon and Adelaide
  • Have a 3 and 2 record against teams in the top 4

Essendon

  • Have a 4.5 and 6.5 record and a Percentage around 90
  • Rank 7th on Points For and on Points Against
  • Went 2 and 4 in the 1st half of the season, and 2.5 and 2.5 in the 2nd half
  • Faced only 2 finalists in the last 6 rounds of the season, winning 1 and drawing the other
  • Have a 2 and 0 record against Carlton
  • Have a 2 and 4 record against teams in the top 4

Adelaide

  • Have a 4 and 7 record and a Percentage around 90
  • Rank 5th on Points For and 6th on Points Against
  • Went 3 and 4 in the 1st half of the season, and 1 and 3 in the 2nd half
  • Have a 2 and 0 record against Carlton
  • Have a 0 and 2 record against St Kilda and against Geelong
  • Have a 1 and 6 record against teams in the top 4

Brisbane Lions

  • Have a 3.5 and 7.5 record and a Percentage around 90
  • Rank 8th on Points For but 4th on Points Against
  • Went 2 and 5 in the 1st half of the season, and 1.5 and 2.5 in the 2nd half
  • Have a 0 and 2 record against Collingwood and against Carlton
  • Have a 1 and 5 record against teams in the top 4

And the Last Shall be First (At Least Occasionally)

So far we've learned that handicap-adjusted margins appear to be normally distributed with a mean of zero and a standard deviation of 37.7 points. That means that the unadjusted margin - from the favourite's viewpoint - will be normally distributed with a mean equal to minus the handicap and a standard deviation of 37.7 points. So, if we want to simulate the result of a single game we can generate a random Normal deviate (surely a statistical contradiction in terms) with this mean and standard deviation.

Alternatively, we can, if we want, work from the head-to-head prices if we're willing to assume that the overround attached to each team's price is the same. If we assume that, then the home team's probability of victory is the head-to-head price of the underdog divided by the sum of the favourite's head-to-head price and the underdog's head-to-head price.

So, for example, if the market was Carlton $3.00 / Geelong $1.36, then Carlton's probability of victory is 1.36 / (3.00 + 1.36) or about 31%. More generally let's call the probability we're considering P%.

Working backwards then we can ask: what value of x for a Normal distribution with mean 0 and standard deviation 37.7 puts P% of the distribution on the left? This value will be the appropriate handicap for this game.

Again an example might help, so let's return to the Carlton v Geelong game from earlier and ask what value of x for a Normal distribution with mean 0 and standard deviation 37.7 puts 31% of the distribution on the left? The answer is -18.5. This is the negative of the handicap that Carlton should receive, so Carlton should receive 18.5 points start. Put another way, the head-to-head prices imply that Geelong is expected to win by about 18.5 points.

With this result alone we can draw some fairly startling conclusions.

In a game with prices as per the Carlton v Geelong example above, we know that 69% of the time this match should result in a Geelong victory. But, given our empirically-based assumption about the inherent variability of a football contest, we also know that Carlton, as well as winning 31% of the time, will win by 6 goals or more about 1 time in 14, and will win by 10 goals or more a litle less than 1 time in 50. All of which is ordained to be exactly what we should expect when the underlying stochastic framework is that Geelong's victory margin should follow a Normal distribution with a mean of 18.8 points and a standard deviation of 37.7 points.

So, given only the head-to-head prices for each team, we could readily simulate the outcome of the same game as many times as we like and marvel at the frequency with which apparently extreme results occur. All this is largely because 37.7 points is a sizeable standard deviation.

Well if simulating one game is fun, imagine the joy there is to be had in simulating a whole season. And, following this logic, if simulating a season brings such bounteous enjoyment, simulating say 10,000 seasons must surely produce something close to ecstasy.

I'll let you be the judge of that.

Anyway, using the Wednesday noon (or nearest available) head-to-head TAB Sportsbet prices for each of Rounds 1 to 20, I've calculated the relevant team probabilities for each game using the method described above and then, in turn, used these probabilities to simulate the outcome of each game after first converting these probabilities into expected margins of victory.

(I could, of course, have just used the line betting handicaps but these are posted for some games on days other than Wednesday and I thought it'd be neater to use data that was all from the one day of the week. I'd also need to make an adjustment for those games where the start was 6.5 points as these are handled differently by TAB Sportsbet. In practice it probably wouldn't have made much difference.)

Next, armed with a simulation of the outcome of every game for the season, I've formed the competition ladder that these simulated results would have produced. Since my simulations are of the margins of victory and not of the actual game scores, I've needed to use points differential - that is, total points scored in all games less total points conceded - to separate teams with the same number of wins. As I've shown previously, this is almost always a distinction without a difference.

Lastly, I've repeated all this 10,000 times to generate a distribution of the ladder positions that might have eventuated for each team across an imaginary 10,000 seasons, each played under the same set of game probabilities, a summary of which I've depicted below. As you're reviewing these results keep in mind that every ladder has been produced using the same implicit probabilities derived from actual TAB Sportsbet prices for each game and so, in a sense, every ladder is completely consistent with what TAB Sportsbet 'expected'.

Simulated Seasons.png

The variability you're seeing in teams' final ladder positions is not due to my assuming, say, that Melbourne were a strong team in one season's simulation, an average team in another simulation, and a very weak team in another. Instead, it's because even weak teams occasionally get repeatedly lucky and finish much higher up the ladder than they might reasonably expect to. You know, the glorious uncertainty of sport and all that.

Consider the row for Geelong. It tells us that, based on the average ladder position across the 10,000 simulations, Geelong ranks 1st, based on its average ladder position of 1.5. The barchart in the 3rd column shows the aggregated results for all 10,000 simulations, the leftmost bar showing how often Geelong finished 1st, the next bar how often they finished 2nd, and so on.

The column headed 1st tells us in what proportion of the simulations the relevant team finished 1st, which, for Geelong, was 68%. In the next three columns we find how often the team finished in the Top 4, the Top 8, or Last. Finally we have the team's current ladder position and then, in the column headed Diff, a comparison of the each teams' current ladder position with its ranking based on the average ladder position from the 10,000 simulations. This column provides a crude measure of how well or how poorly teams have fared relative to TAB Sportsbet's expectations, as reflected in their head-to-head prices.

Here are a few things that I find interesting about these results:

  • St Kilda miss the Top 4 about 1 season in 7.
  • Nine teams - Collingwood, the Dogs, Carlton, Adelaide, Brisbane, Essendon, Port Adelaide, Sydney and Hawthorn - all finish at least once in every position on the ladder. The Bulldogs, for example, top the ladder about 1 season in 25, miss the Top 8 about 1 season in 11, and finish 16th a little less often than 1 season in 1,650. Sydney, meanwhile, top the ladder about 1 season in 2,000, finish in the Top 4 about 1 season in 25, and finish last about 1 season in 46.
  • The ten most-highly ranked teams from the simulations all finished in 1st place at least once. Five of them did so about 1 season in 50 or more often than this.
  • Every team from ladder position 3 to 16 could, instead, have been in the Spoon position at this point in the season. Six of those teams had better than about a 1 in 20 chance of being there.
  • Every team - even Melbourne - made the Top 8 in at least 1 simulated season in 200. Indeed, every team except Melbourne made it into the Top 8 about 1 season in 12 or more often.
  • Hawthorn have either been significantly overestimated by the TAB Sportsbet bookie or deucedly unlucky, depending on your viewpoint. They are 5 spots lower on the ladder than the simulations suggest that should expect to be.
  • In contrast, Adelaide, Essendon and West Coast are each 3 spots higher on the ladder than the simulations suggest they should be.

(In another blog I've used the same simulation methodology to simulate the last two rounds of the season and project where each team is likely to finish.)

Game Cadence

If you were to consider each quarter of football as a separate contest, what pattern of wins and losses do you think has been most common? Would it be where one team wins all 4 quarters and the other therefore losses all 4? Instead, might it be where teams alternated, winning one and losing the next, or vice versa? Or would it be something else entirely?

The answer, it turns out, depends on the period of history over which you ask the question. Here's the data:

Game Cadence.png

So, if you consider the entire expanse of VFL/AFL history, the egalitarian "WLWL / LWLW" cadence has been most common, occurring in over 18% of all games. The next most common cadence, coming in at just under 15% is "WWWW / LLLL" - the Clean Sweep, if you will. The next four most common cadences all have one team winning 3 quarters and the other winning the remaining quarter, each of which such cadences have occurred about 10-12% of the time. The other patterns have occurred with frequencies as shown under the 1897 to 2009 columns, and taper off to the rarest of all combinations in which 3 quarters were drawn and the other - the third quarter as it happens - was won by one team and so lost by the other. This game took place in Round 13 of 1901 and involved Fitzroy and Collingwood.

If, instead, you were only to consider more recent seasons excluding the current one, say from 1980 to 2008, you'd find that the most common cadence has been the Clean Sweep on about 18%, with the "WLLL / "LWWW" cadence in second on a little over 12%. Four other cadences then follow in the 10-11.5% range, three of them involving one team winning 3 of the 4 quarters and the other the "WLWL / LWLW" cadence.

In short it seems that teams have tended to dominate contests more in the 1980 to 2008 period than had been the case historically.

(It's interesting to note that, amongst those games where the quarters are split 2 each, "WLWL / LWLW" is more common than either of the two other possible cadences, especially across the entire history of footy.)

Turning next to the current season, we find that the Clean Sweep has been the most common cadence, but is only a little ahead of 5 other cadences, 3 of these involving a 3-1 split of quarters and 2 of them involving a 2-2 split.

So, 2009 looks more like the period 1980 to 2008 than it does the period 1897 to 2009.

What about the evidence for within-game momentum in the quarter-to-quarter cadence? In other words, are teams who've won the previous quarter more or less likely to win the next?

Once again, the answer depends on your timeframe.

Across the period 1897 to 2009 (and ignoring games where one of the two relevant quarters was drawn):

  • teams that have won the 1st quarter have also won the 2nd quarter about 46% of the time
  • teams that have won the 2nd quarter have also won the 3rd quarter about 48% of the time
  • teams that have won the 3rd quarter have also won the 4th quarter just under 50% of the time.

So, across the entire history of football, there's been, if anything, an anti-momentum effect, since teams that win one quarter have been a little less likely to win the next.

Inspecting the record for more recent times, however, consistent with our earlier conclusion about the greater tendency for teams to dominate matches, we find that, for the periods 1980 to 2008 (and, in brackets, for 2009):

  • teams that have won the 1st quarter have also won the 2nd quarter about 52% of the time a little less in 2009)
  • teams that have won the 2nd quarter have also won the 3rd quarter about 55% of the time (a little more in 2009)
  • teams that have won the 3rd quarter have also won the 4th quarter just under 55% of the time (but only 46% for 2009).

In more recent history then, there is evidence of within-game momentum.

All of which would lead you to believe that winning the 1st quarter should be particularly important, since it gets the momentum moving in the right direction right from the start. And, indeed, this season that has been the case, as teams that have won matches have also won the 1st quarter in 71% of those games, the greatest proportion of any quarter.

July - When a Fan's Thoughts Turn to Tanking

Most major Australian sports have their iconic annual event. Cricket has its Boxing Day test, tennis and golf have their respective Australian Opens, rugby league has the State of Origin series, rugby union the Bledisloe, and AFL, it now seems, has the Tanking Debate, usually commencing near Round 15 or 16 and running to the end of the season proper.

The T-word has been all over the Melbourne newspapers and various footy websites this week, perhaps most startlingly in the form of Terry Wallace's admission that in Round 22 of 2007 in the Tigers clash against St Kilda, a game in which the Tigers led by 3 points at the final change but went on to lose by 10 points:

"while he had not "tanked" during the Trent Cotchin game in Round 22, 2007, he had let the contest run its natural course without intervention"

That stain on the competition's reputation (coupled, I'll admit, with he realisation that the loss cost MAFL Investors an additional return of about 13% for that year) makes it all the more apparent to me that the draft system, especially the priority draft component, must change.

Here's what I wrote on the topic - presciently as it turns out - in the newsletter for Round 19 of 2007.

Tanking and the Draft

If you’re a diehard AFL fan and completely conversant with the nuances of the Draft, please feel free to skip this next section of the newsletter.

I thought that a number of you might be interested to know why, in some quarters, there’s such a fuss around this time of year about “The Draft” and its potential impact on the commitment levels of teams towards the bottom of the ladder.

The Draft is, as Wikipedia puts it, the “annual draft of young talent” into the AFL that takes place prior to the start of each season. In the words of the AFL’s own website:

"In simple terms, the NAB AFL Draft is designed to give clubs which finished lower on the ladder the first opportunity to pick the best new talent in Australia. At season's end, all clubs are allocated draft selections. The club that finished last receives the first selection, the second last team gets the second selection and so on until the premier receives the 16th selection."

So, here’s the first issue: towards season’s end, those teams for whom all hopes of a Finals berth have long since left the stadium find that there’s more to be gained by losing games than there is by winning them.

Why? Well say, for example, that Richmond suddenly remembered what the big sticks are there for and jagged two wins in the last four games, leaping a startled Melbourne in the process, relegating them to position Spoon. The Tigers’ reward for such a stunning effort would be to (possibly – see below) hand Melbourne the sweetest of draft plums, the Number 1 draft pick, while relegating themselves to the Number 2 pick. Now, in truth, over the years, Number 1 picks have not always worked out better than Number 2 picks, but think about it this way: isn’t it always nicer to have first hand into the Quality Assortment?

Now entereth the notion of Priority Picks, which accrue to those teams who have demonstrated season-long ineptitude to the extent that they’ve accumulated fewer than 17 points over its duration. They get a second draft pick prior to everyone else’s second draft pick and then a third pick not that long after, once all the other Priority Picks have taken place. So, for example, if a team comes last and wins, say, four games, it gets Pick #1, Pick #17 (their Priority pick, immediately after all the remaining teams have had their first pick) and then Pick #18 (their true second round Pick). If more than one team is in entitled to Priority Picks then the Picks are taken in reverse ladder order.

Still with me?

Now, the final twist. If a team has proven its footballing inadequacy knows not the bounds of a single year, having done so by securing fewer than 17 points in each of two successive seasons, then it gets its Priority Pick before anyone else gets even their first round pick. Once again, if more than one team is in this situation, then the tips are taken in reverse ladder order.

So, what’s the relevance to this year? Well, last year Carlton managed only 14 points and this year they’re perched precipitously on 16 points. If they lose their next four games, their first three draft picks will be #1 (their Priority Pick), #4 (their first round pick), and #20 (their second round pick); if they win or even draw one or more of their remaining games and do this without leaping a ladder spot, their first three draft picks will be #3, #19 and #35. Which would you prefer?

I find it hard to believe that a professional footballer or coach could ever succumb to the temptation to “tank” games (as it’s called), but the game’s administrators should never have set up the draft process in such a way that it incites such speculation every year around this time.

I can think of a couple of ways of preserving the intent of the current draft process without so blatantly rewarding failure and inviting suspicion and rumour. We’ll talk about this some more next week.

*****

In the following week's newsletter, I wrote this:

Revising the Draft

With the Tigers and the Dees winning last week, I guess many would feel that the “tanking” issue has been cast aside for yet another season. Up to a point, that’s probably a fair assessment, although only a win by the Blues could truly muffle all the critics.

Regardless, as I said last week, it’s unfair to leave any of the teams in a position where they could even be suspected of putting in anything other than a 100% effort.

I have two suggestions for changes to the draft that would broadly preserve its intent but that would also go a long way to removing much of the contention that currently exists.

(1) Randomise the draft to some extent.

Sure, give teams further down the ladder a strong chance of getting early draft picks, but don’t make ladder position completely determine the pick order. One way to achieve this would be to place balls in an urn with the number of balls increasing as ladder position increased. So, for example, the team that finished 9th might get 5 balls in the urn; 10th might get 6 balls, and so on. Then, draw from this urn to determine the order of draft picks.

Actually, although it’s not strictly in keeping with the current spirit of the draft, I’d like to see this system used in such a way that marginally more balls are placed in the urn for teams higher up the ladder to ensure that all teams are still striving for victory all the way to Round 22.

(2) Base draft picks on ladder position at the end of Round 11, not Round 22.

Sides that are poor performers generally don’t need 22 rounds to prove it; 11 rounds should be more than enough. What’s more, I reckon that it’s far less likely that a team would even consider tanking say rounds 9, 10 and 11 when there’s still so much of the season to go that a spot in the Finals is not totally out of the question. With this approach I’d be happy to stick with the current notion that 1st draft pick accrues to the team at the foot at the ladder.

Under either of these new draft regimes, the notion of Priority Picks has to go. Let’s compensate for underperformance but not lavish it with silken opportunity.

****

My opinion hasn't changed. The changes to the draft for the next few years that have been made to smooth the entry of the Gold Coast into the competition probably mean that we're stuck with a version of the draft we have now for the next few years. After that though, we do have to fix it because it is broken.

The Differential Difference

Though there are numerous differences between the various football codes in Australia, two that have always struck me as arbitrary are AFL's awarding of 4 points for a victory and 2 from a draw (why not, say, pi and pi/2 if you just want to be different?) and AFL's use of percentage rather than points differential to separate teams that are level on competition points.

I'd long suspected that this latter choice would only rarely be significant - that is, that a team with a superior percentage would not also enjoy a superior points differential - and thought it time to let the data speak for itself.

Sure enough, a review of the final competition ladders for all 112 seasons, 1897 to 2008, shows that the AFL's choice of tiebreaker has mattered only 8 times and that on only 3 of those occasions (shown in grey below) has it had any bearing on the conduct of the finals.

PC v FA.png

Historically, Richmond has been the greatest beneficiary of the AFL's choice of tiebreaker, being awarded the higher ladder position on the basis of percentage on 3 occasions when the use of points differential would have meant otherwise. Essendon and St Kilda have suffered most from the use of percentage, being consigned to a lower ladder position on 2 occasions each.

There you go: trivia that even a trivia buff would dismiss as trivial.

The Decline of the Humble Behind

Last year, you might recall, a spate of deliberately rushed behinds prompted the AFL to review and ultimately change the laws relating to this form of scoring.

Has the change led to a reduction in the number of behinds recorded in each game? The evidence is fairly strong:

Goals and Behinds.png

So far this season we've seen 22.3 behinds per game, which is 2.6 per game fewer than we saw in 2008 and puts us on track to record the lowest number of average behinds per game since 1915. Back then though goals came as much more of a surprise, so a spectator at an average game in 1915 could expect to witness only 16 goals to go along with the 22 behinds. Happy days.

This year's behind decline continues a trend during which the number of behinds per game has dropped from a high of 27.3 per game in 1991 to its current level, a full 5 behinds fewer, interrupted only by occasional upticks such as the 25.1 behinds per game recorded in 2007 and the 24.9 recorded in 2008.

While behind numbers have been falling recently, goals per game have also trended down - from 29.6 in 1991, to this season's current average of 26.8. Still, AFL followers can expect to witness more goals than behinds in most games they watch. This wasn't always the case. Not until the season of 1969 had there been a single season with more goals than behinds, and not until 1976 did such an outcome became a regular occurrence. In only one season since then, 1981, have fans endured more behinds than goals across the entire season.

On a game-by-game basis, 90 of 128 games this season, or a smidge over 70%, have produced more goals than behinds. Four more games have produced an equal number of each.

As a logical consequence of all these trends, behinds have had a significantly smaller impact on the result of games, as evidenced by the chart below which shows the percentage of scoring attributable to behinds falling from above 20% in the very early seasons to around 15% across the period 1930 to 1980, to this season's 12.2%, the second-lowest percentage of all time, surpassed only by the 11.9% of season 2000.

Behinds PC.png

(There are more statistical analyses of the AFL on MAFL Online's sister site at MAFL Stats.)