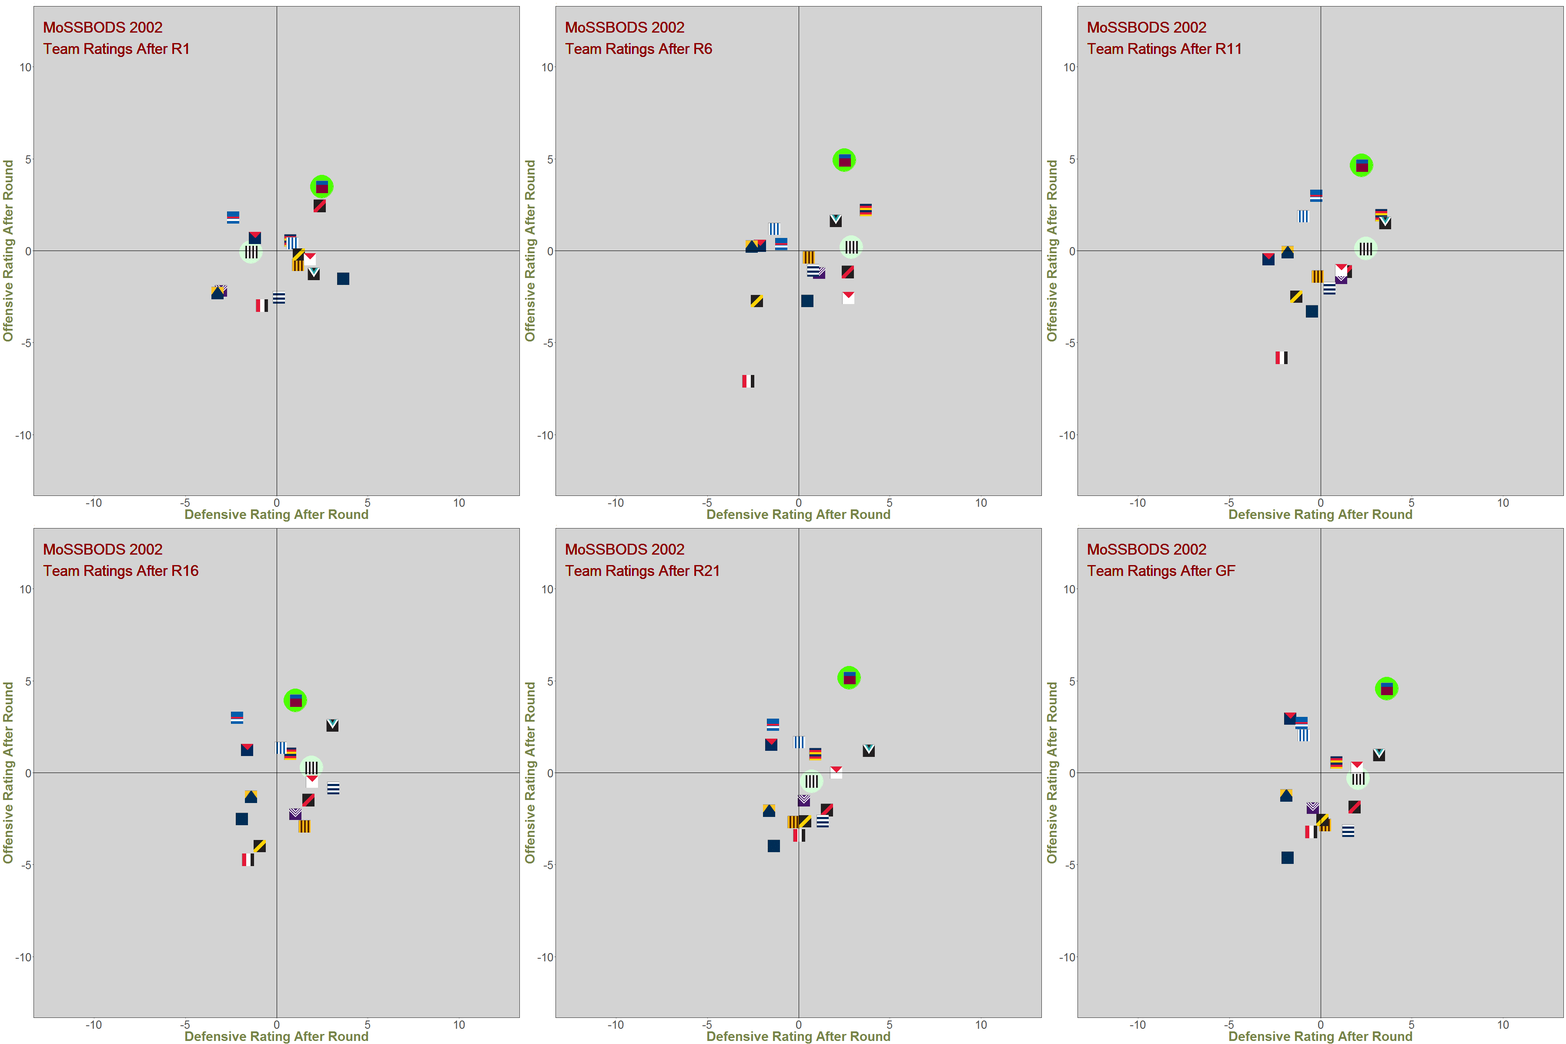
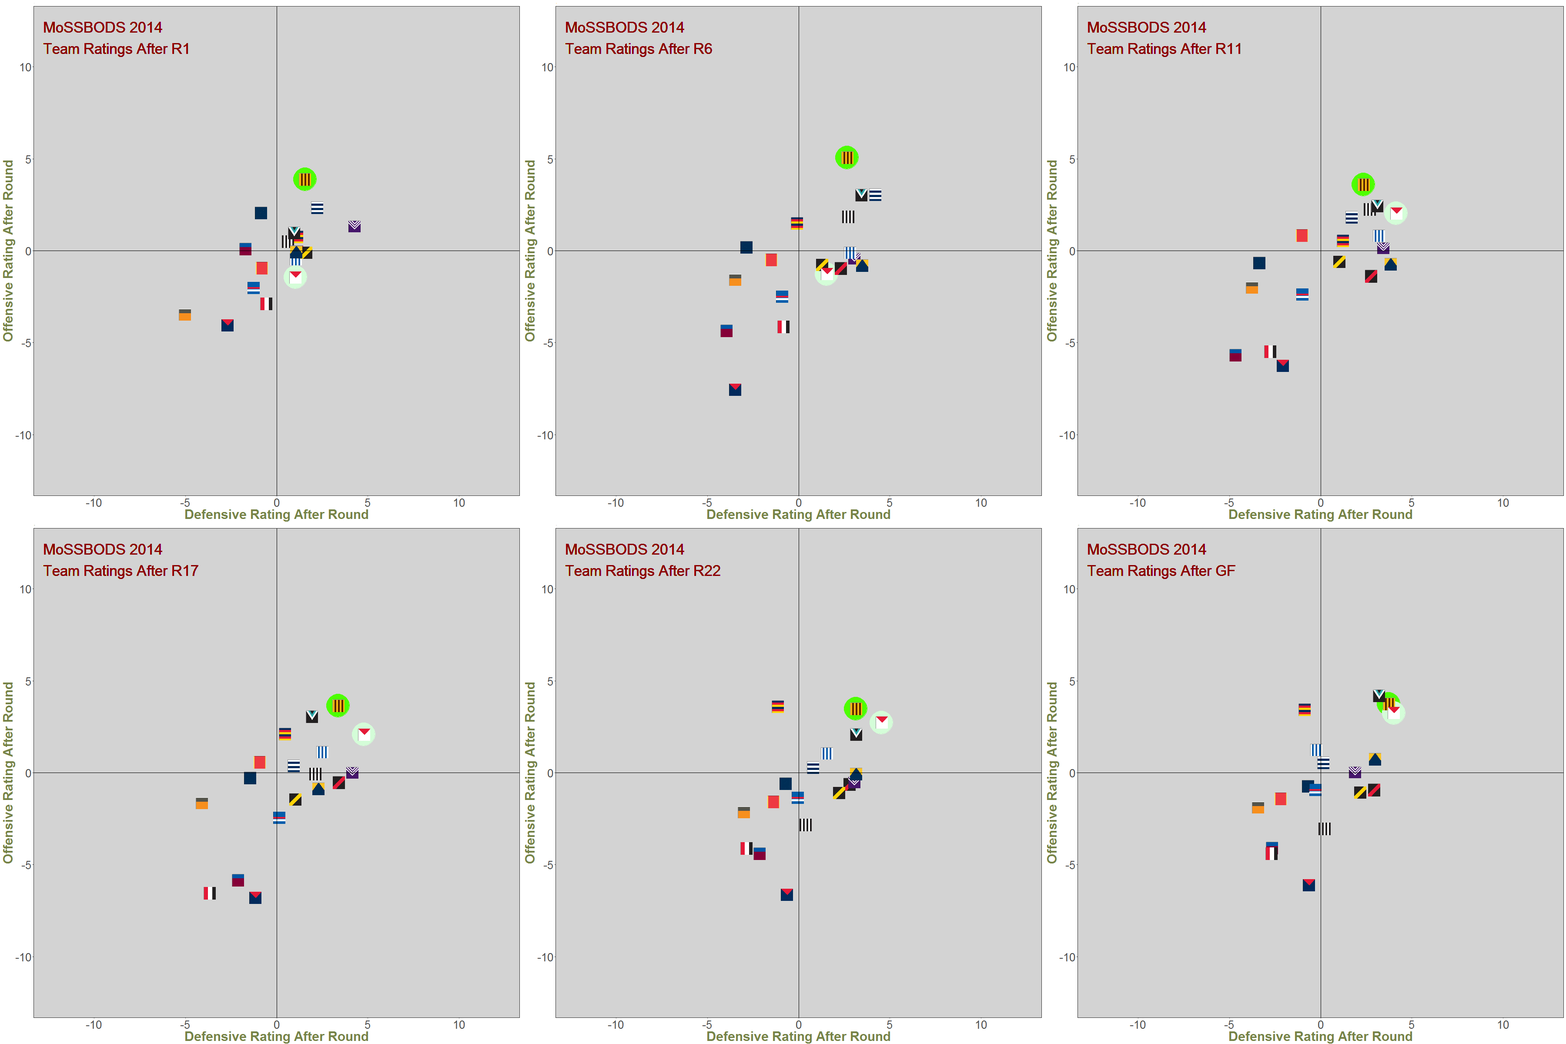
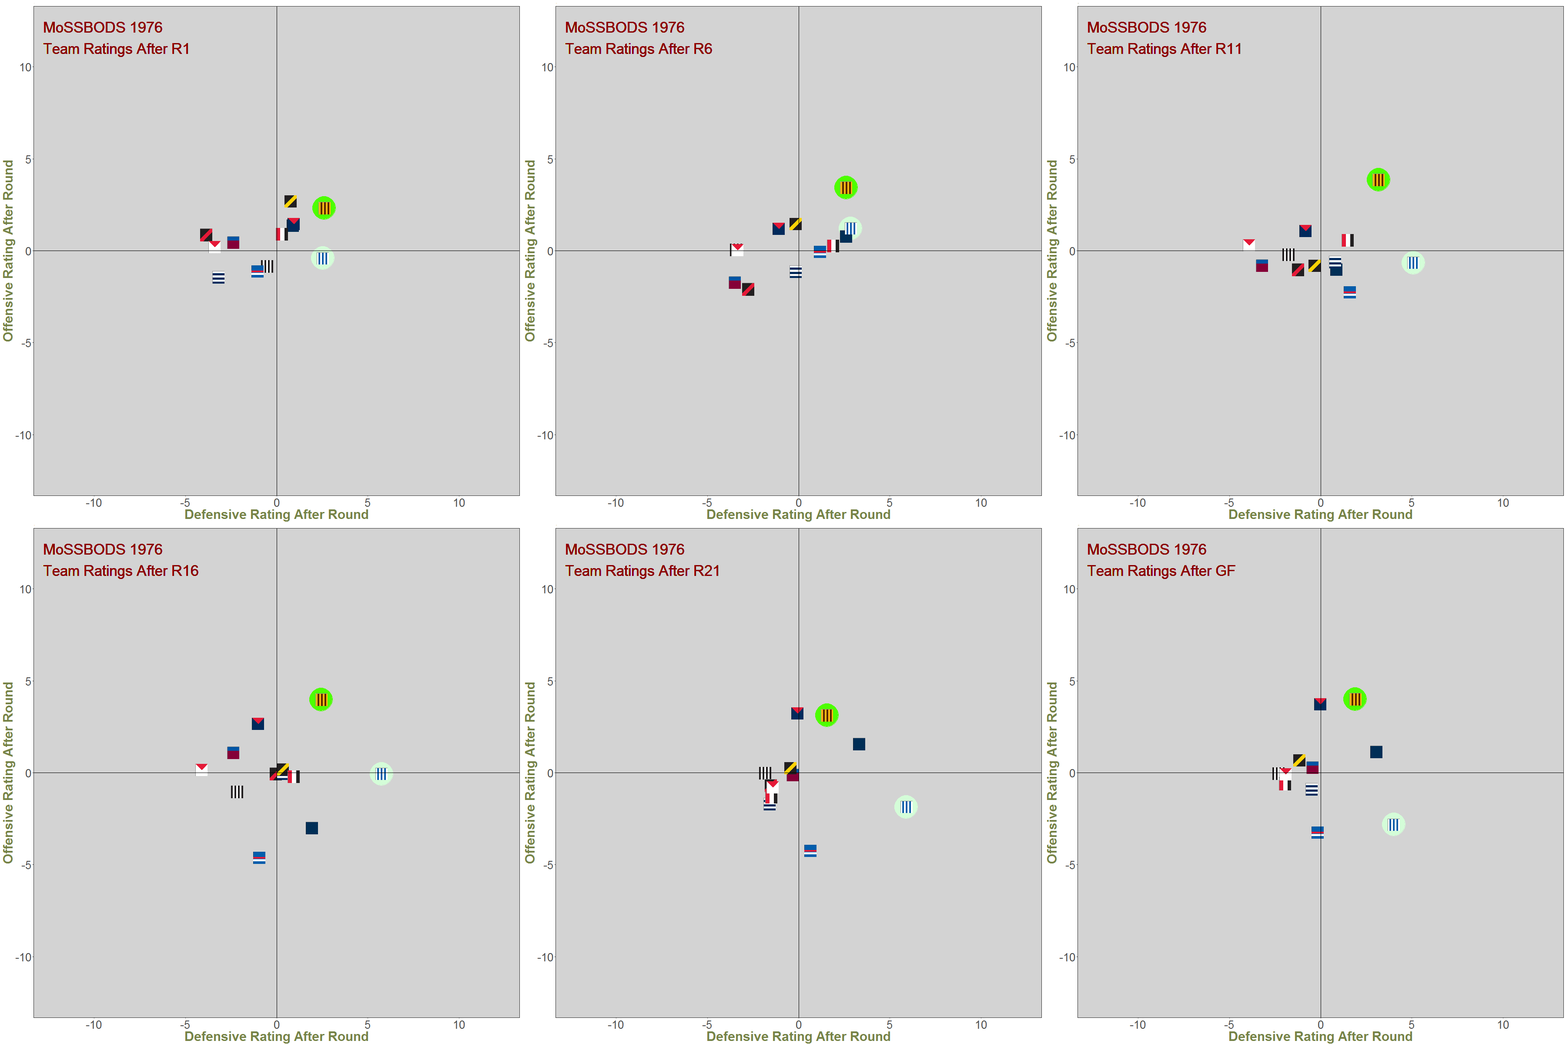
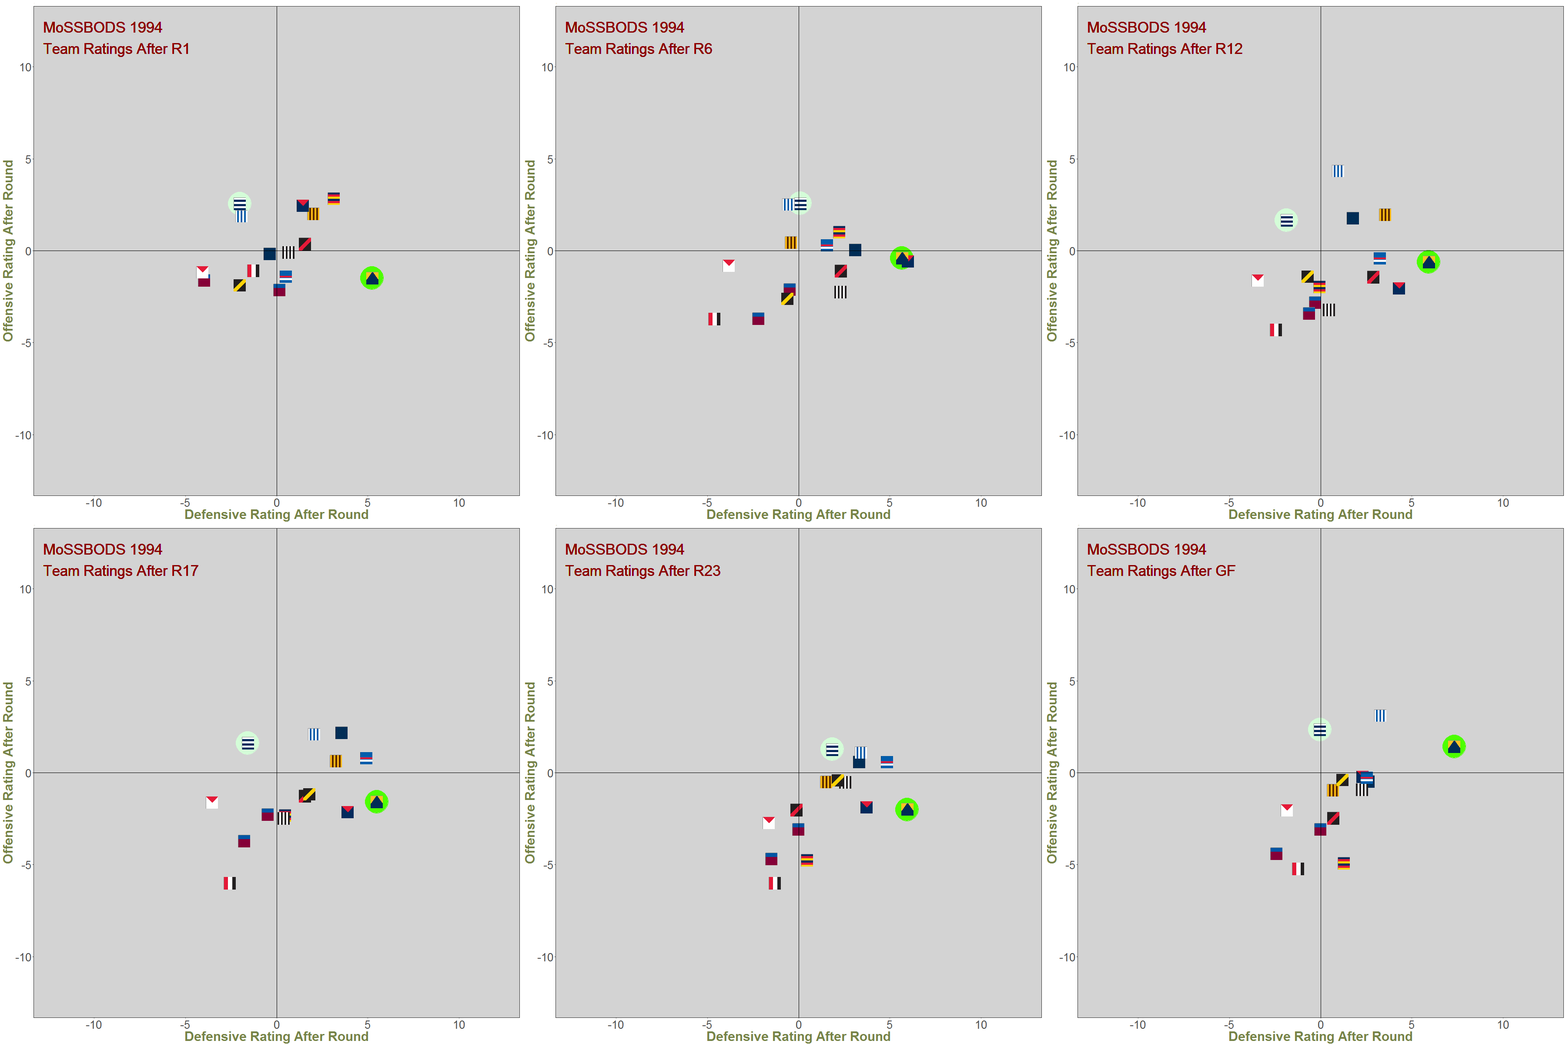
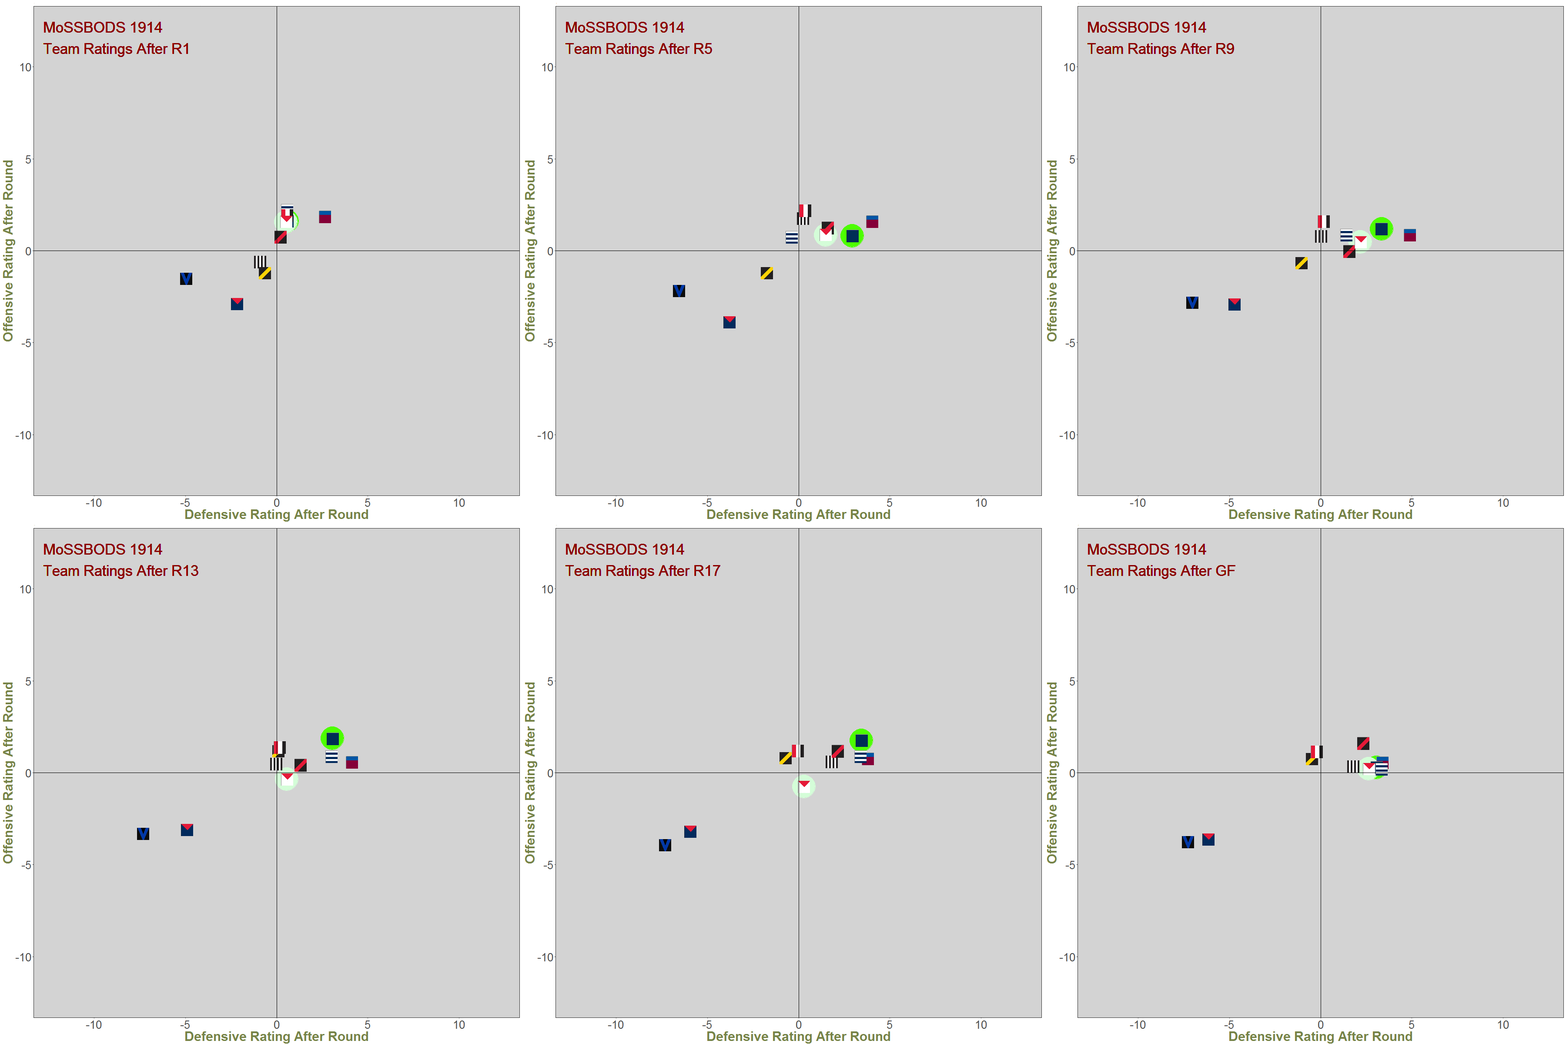
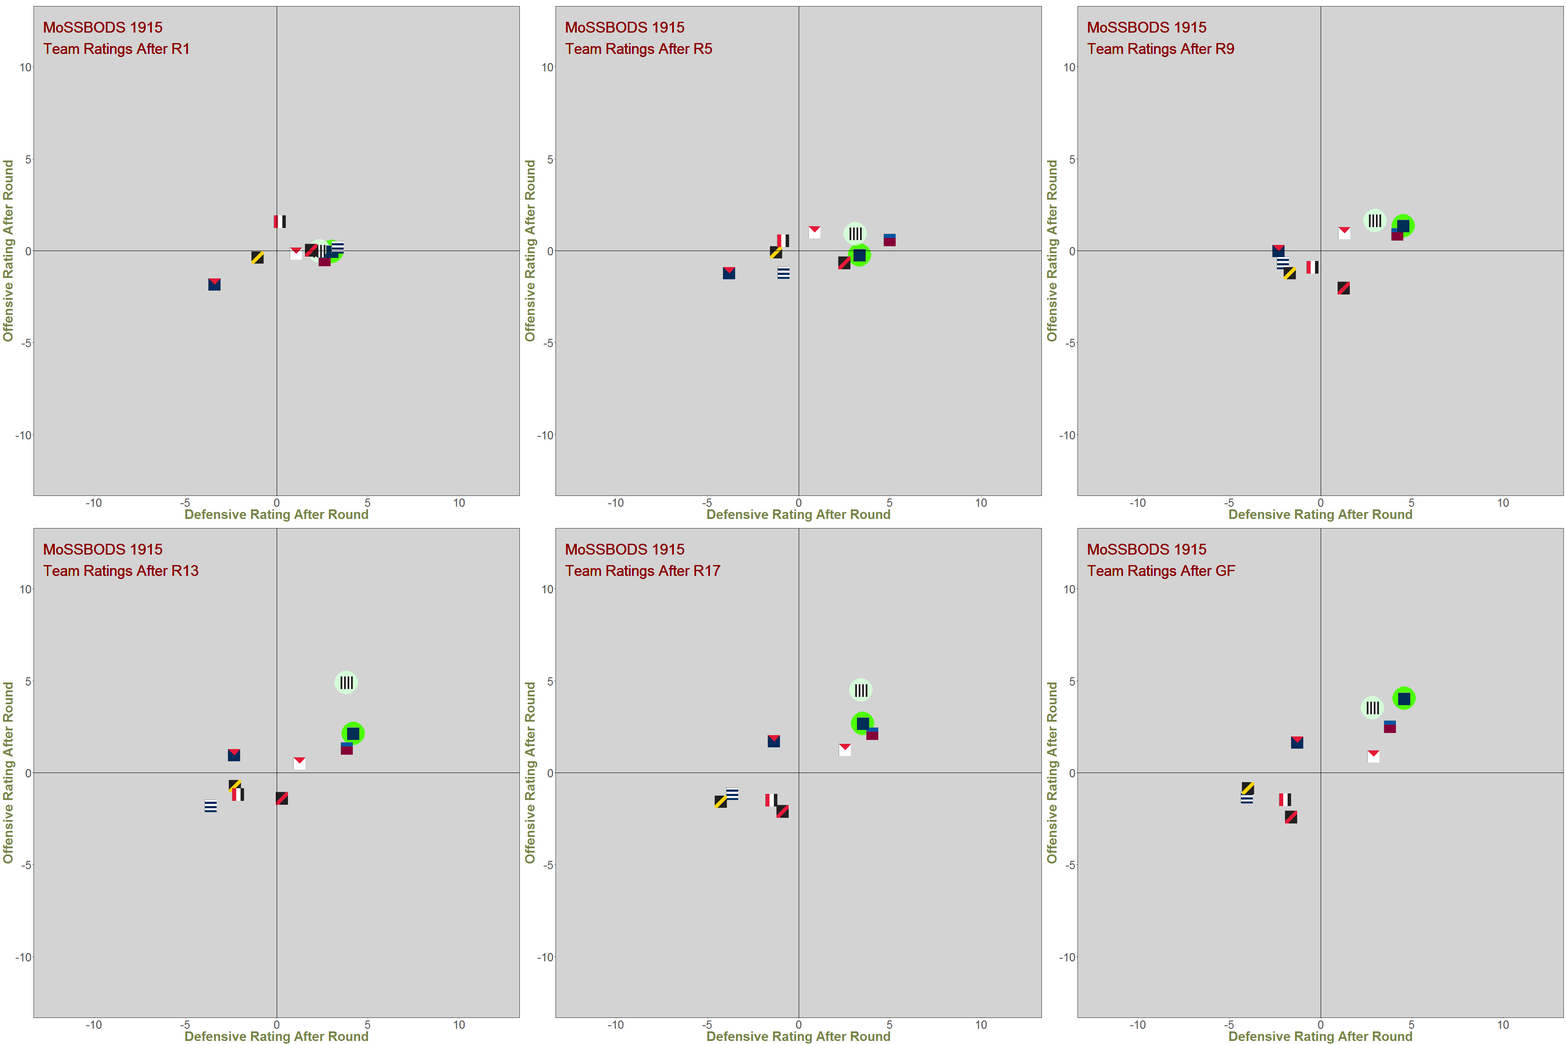
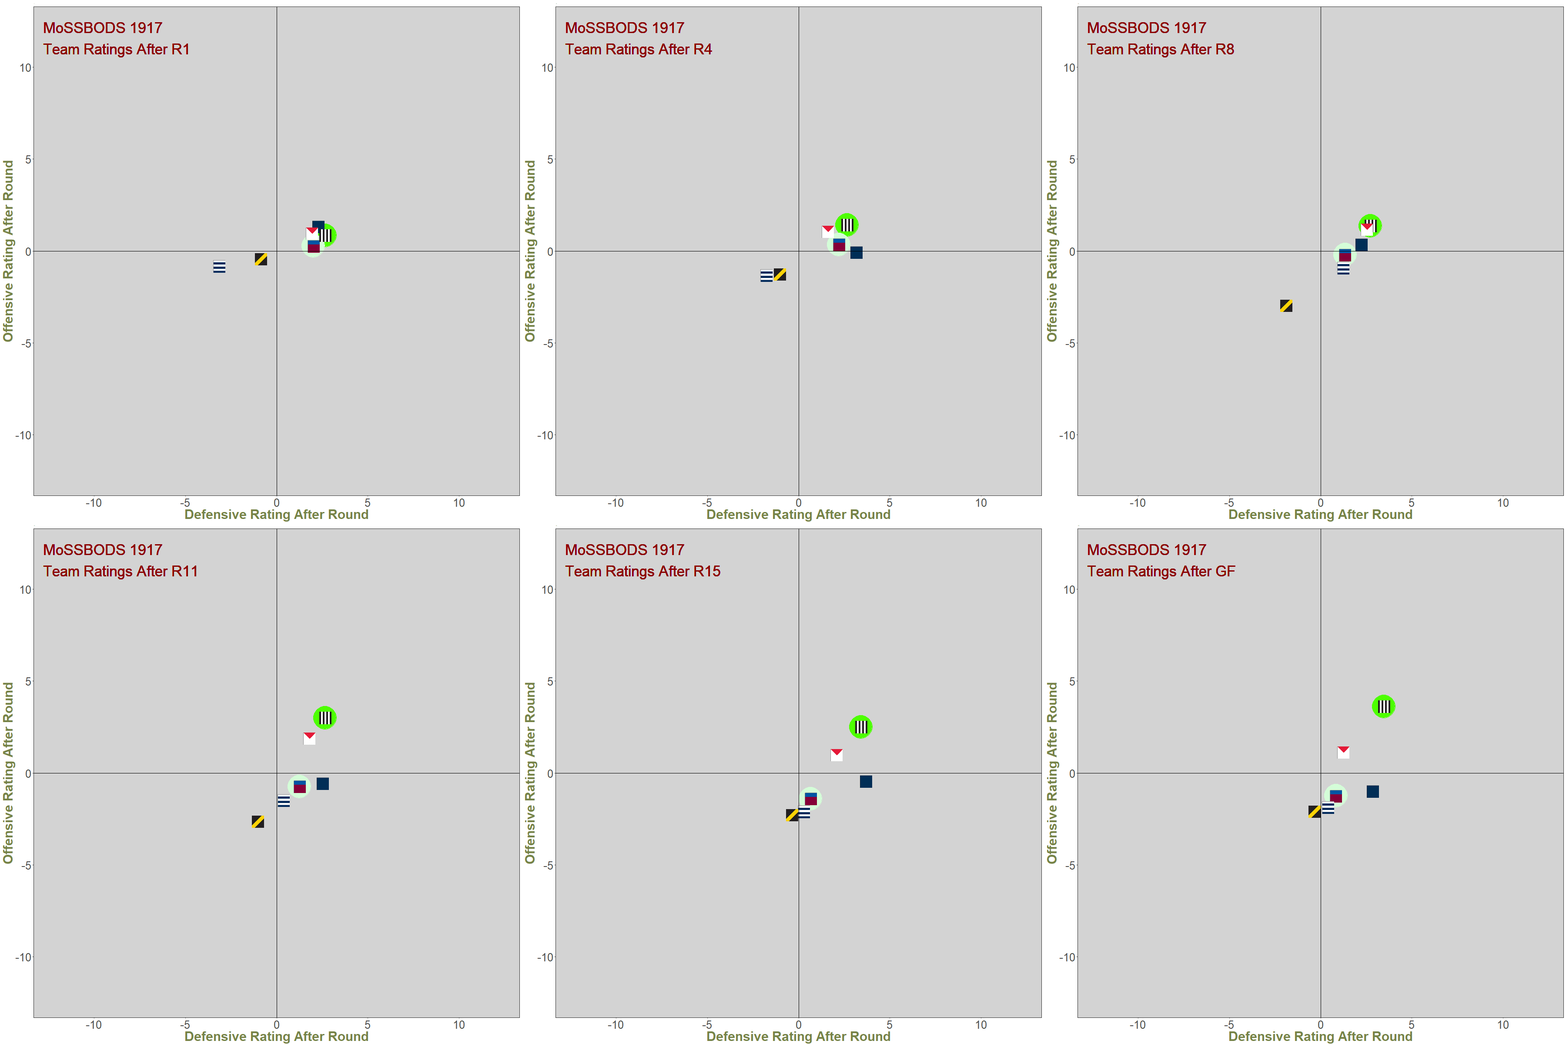
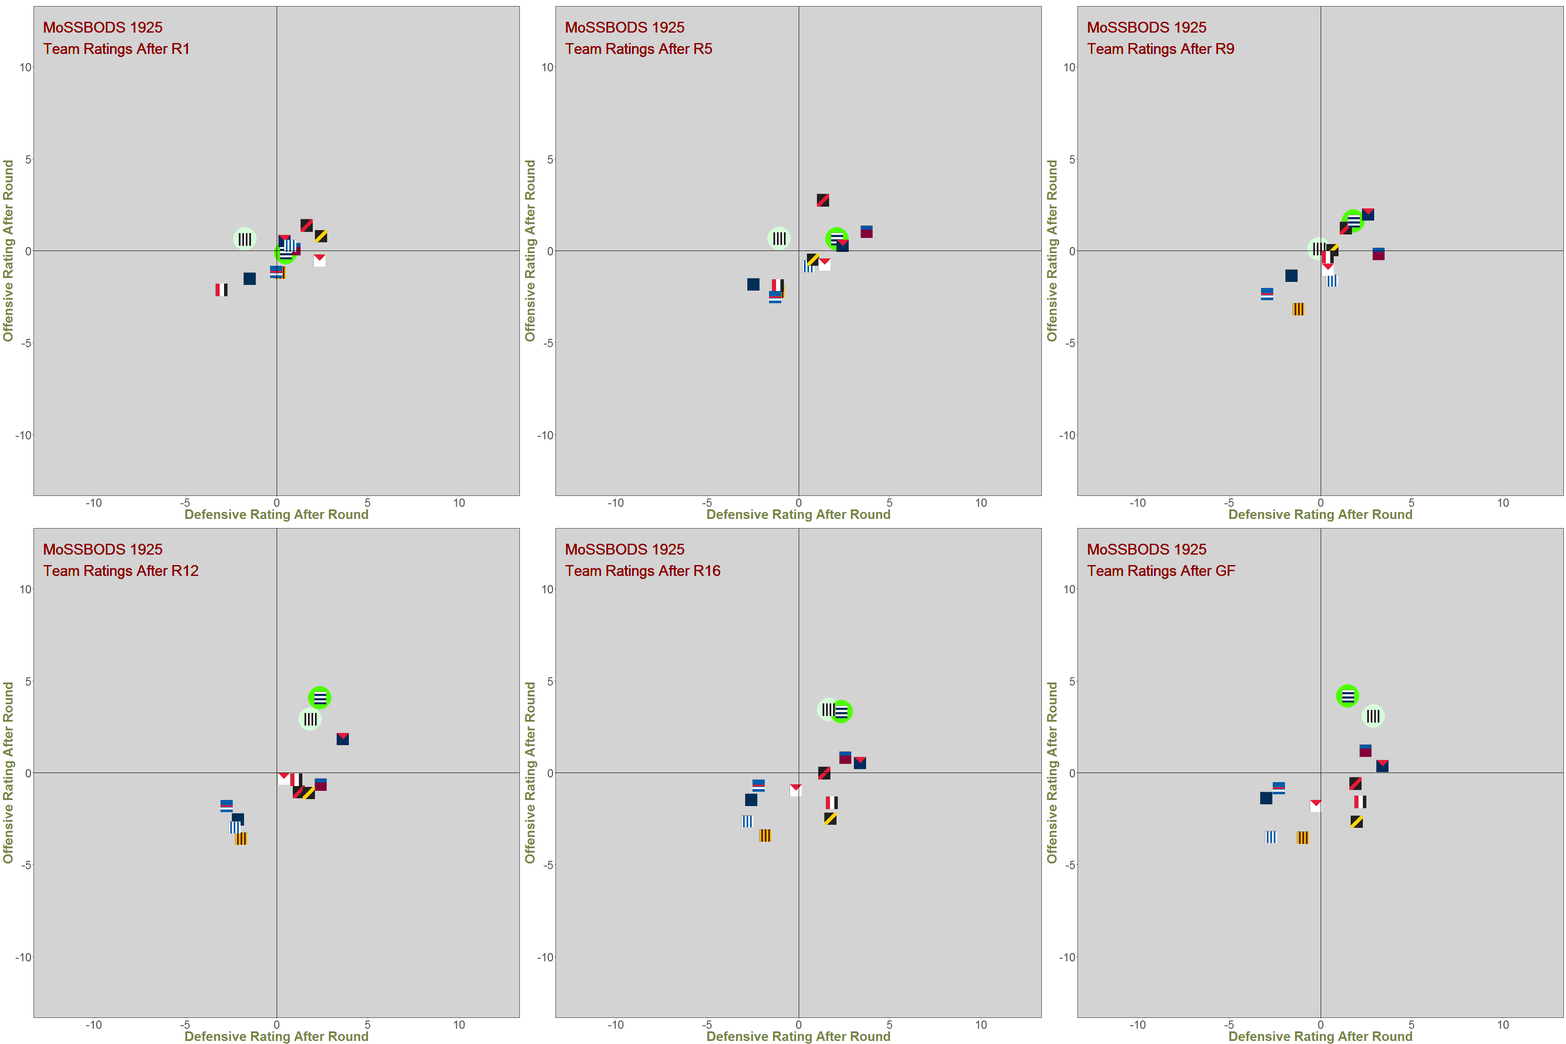
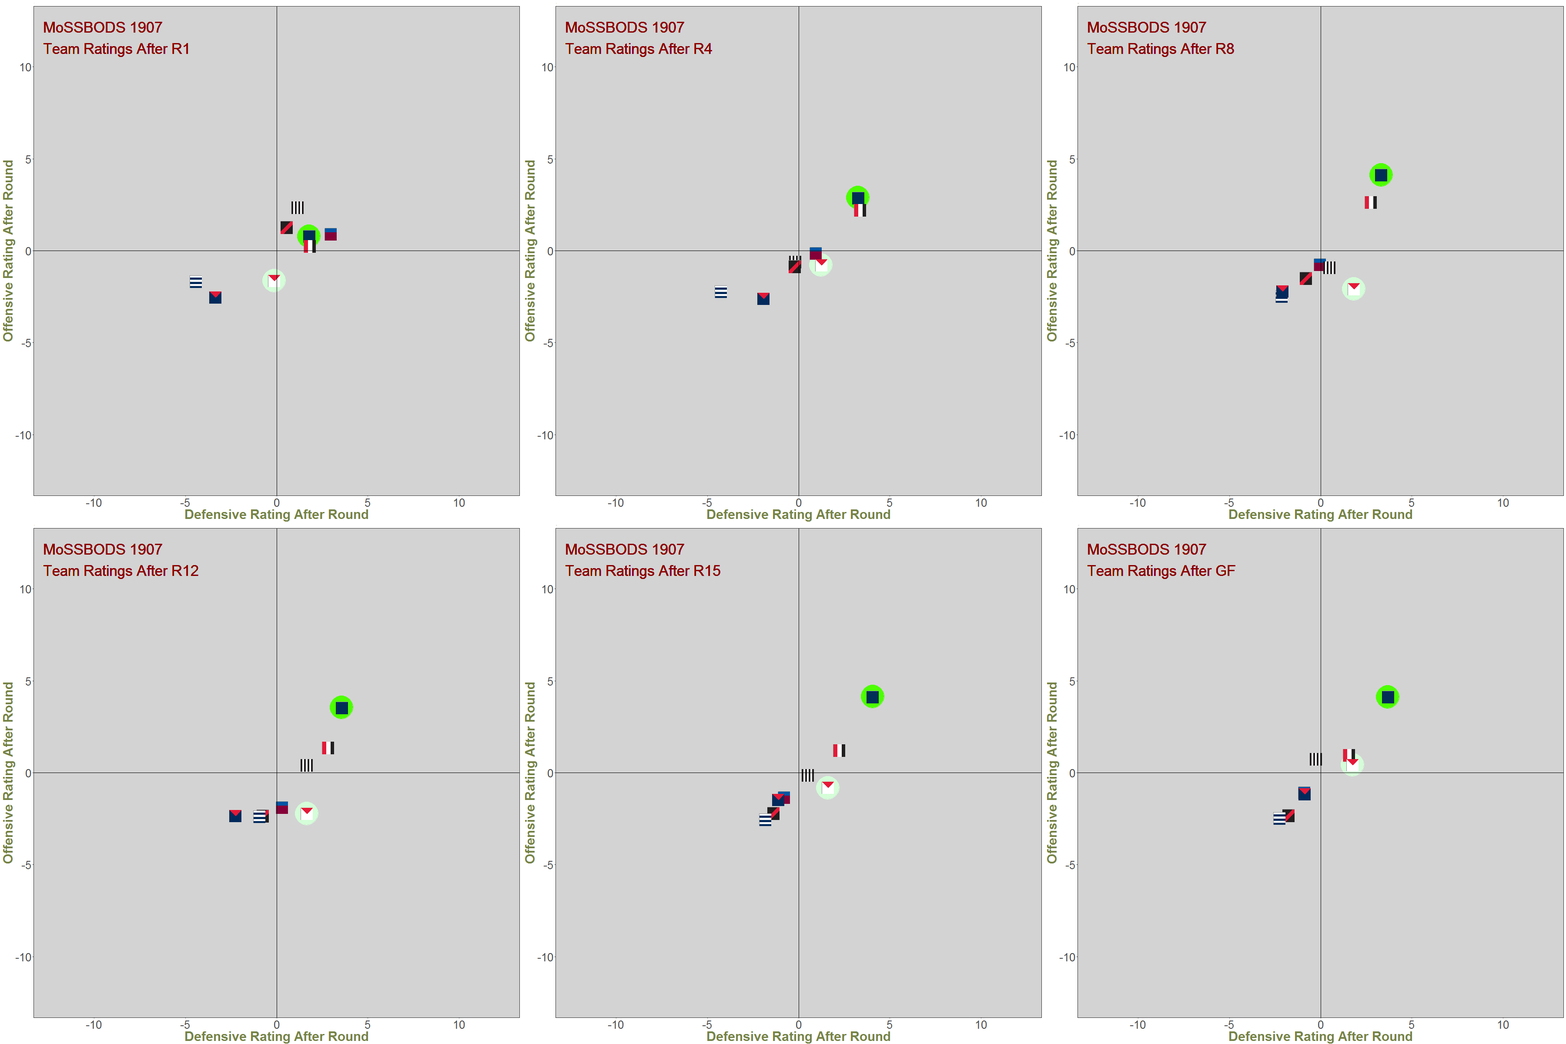
YEAR-BY-YEAR TEAM RATING DANCES
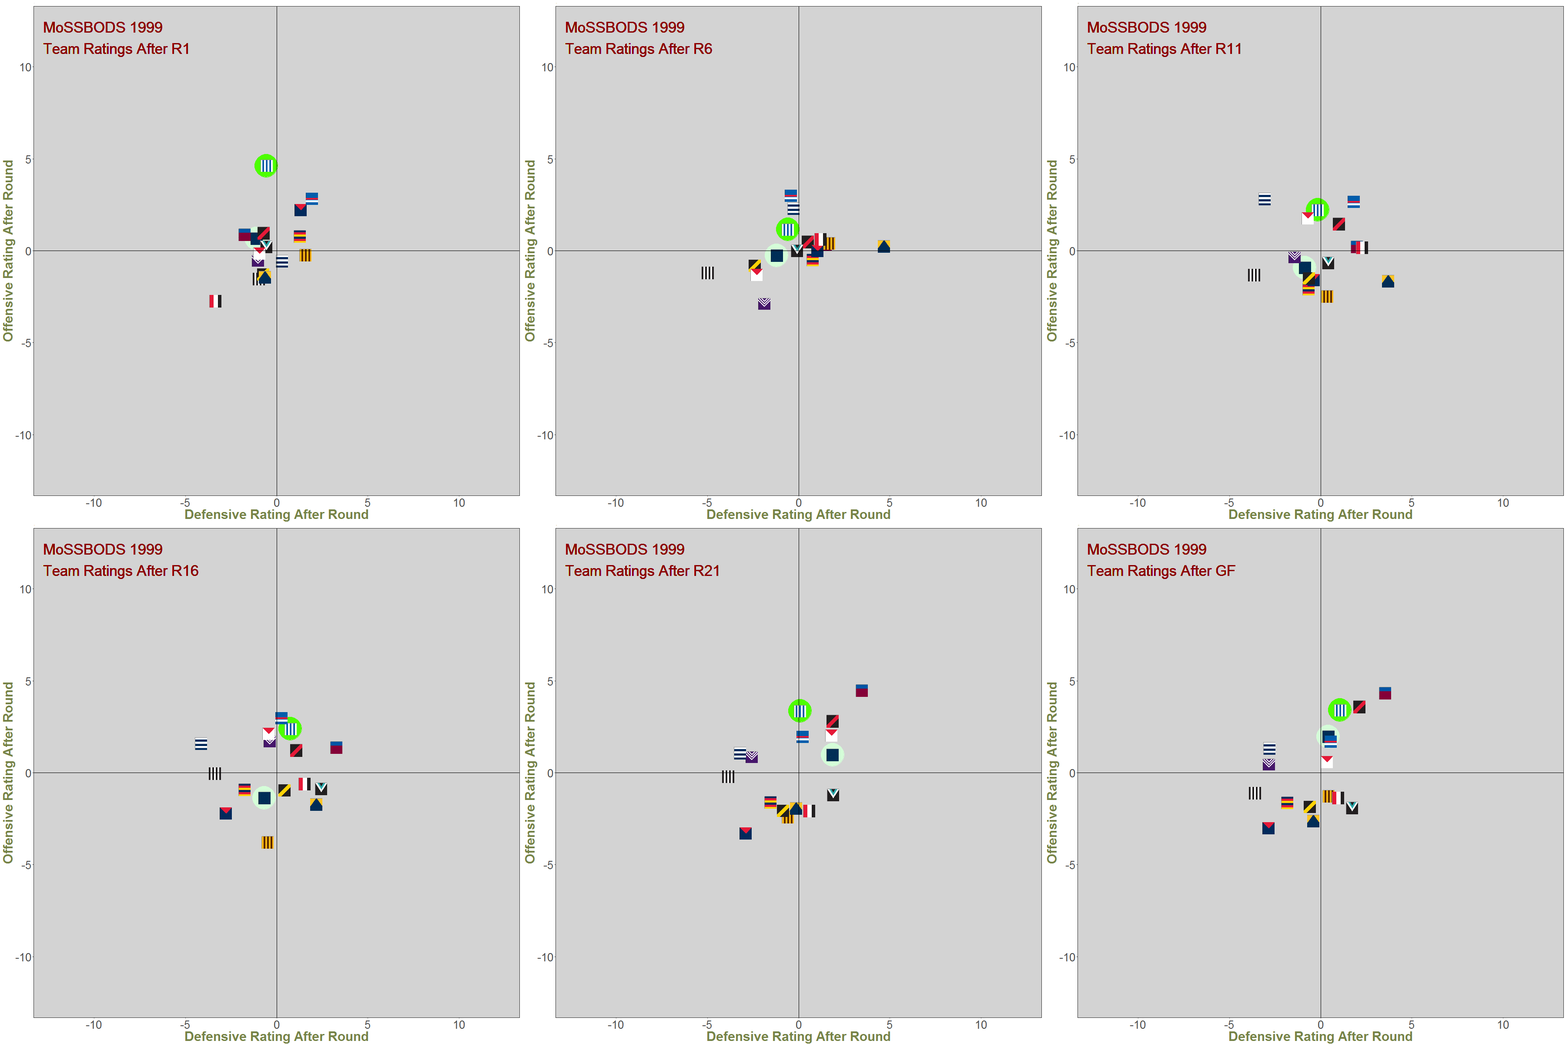
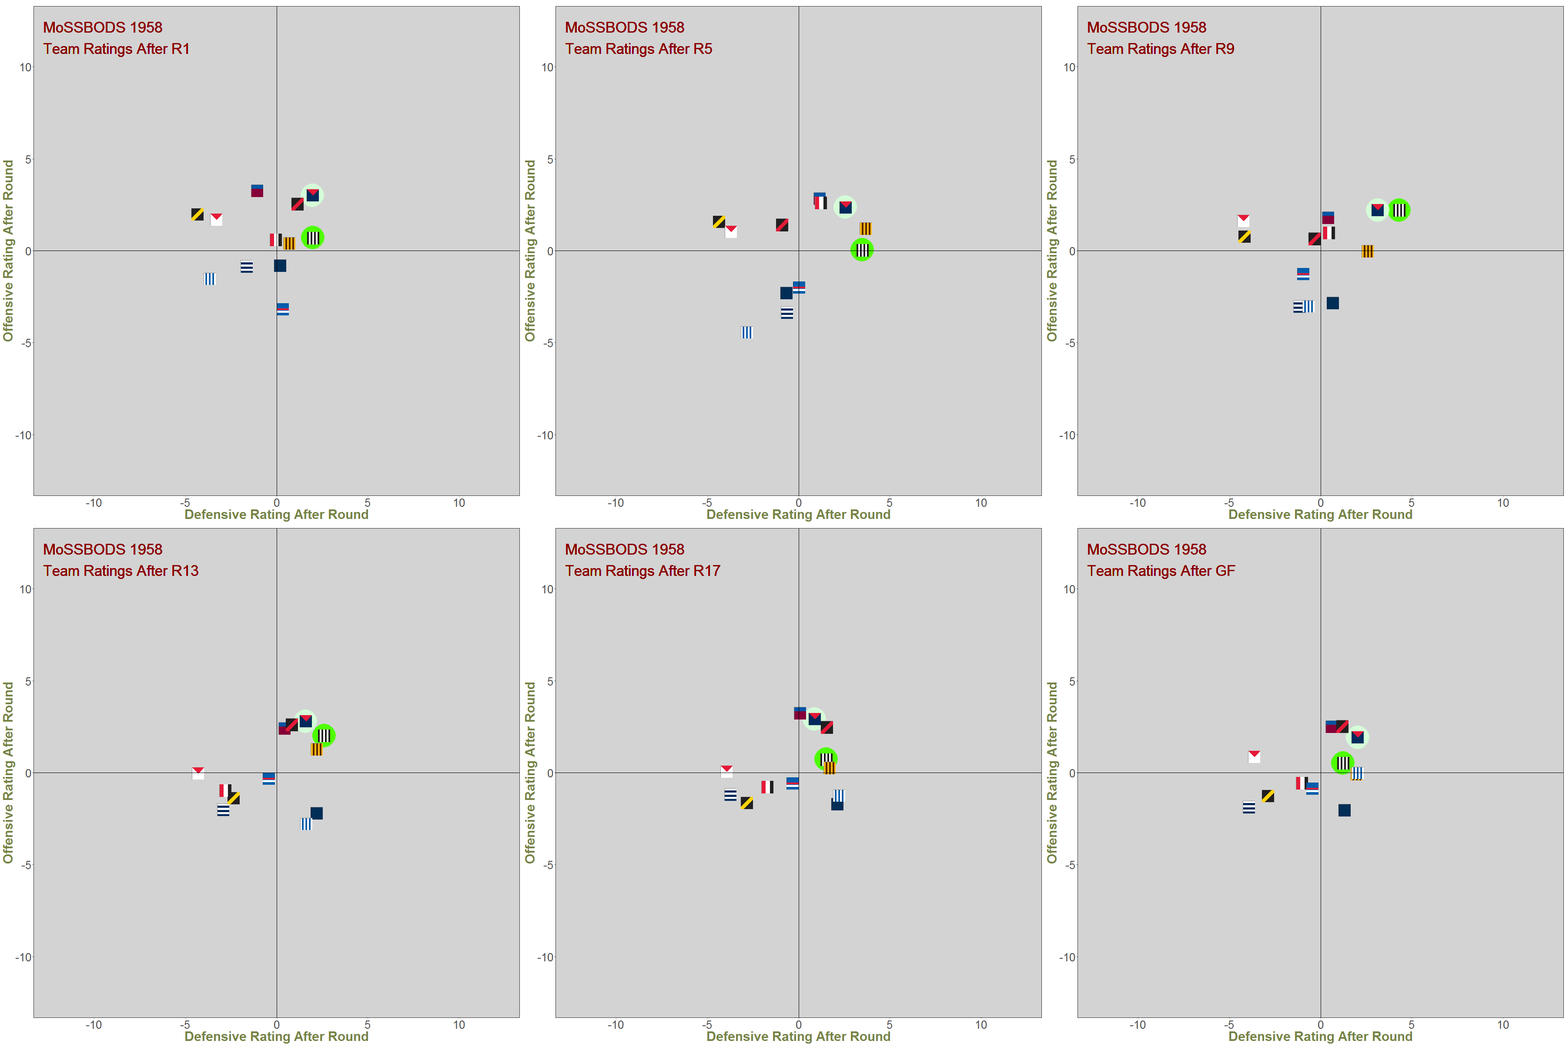
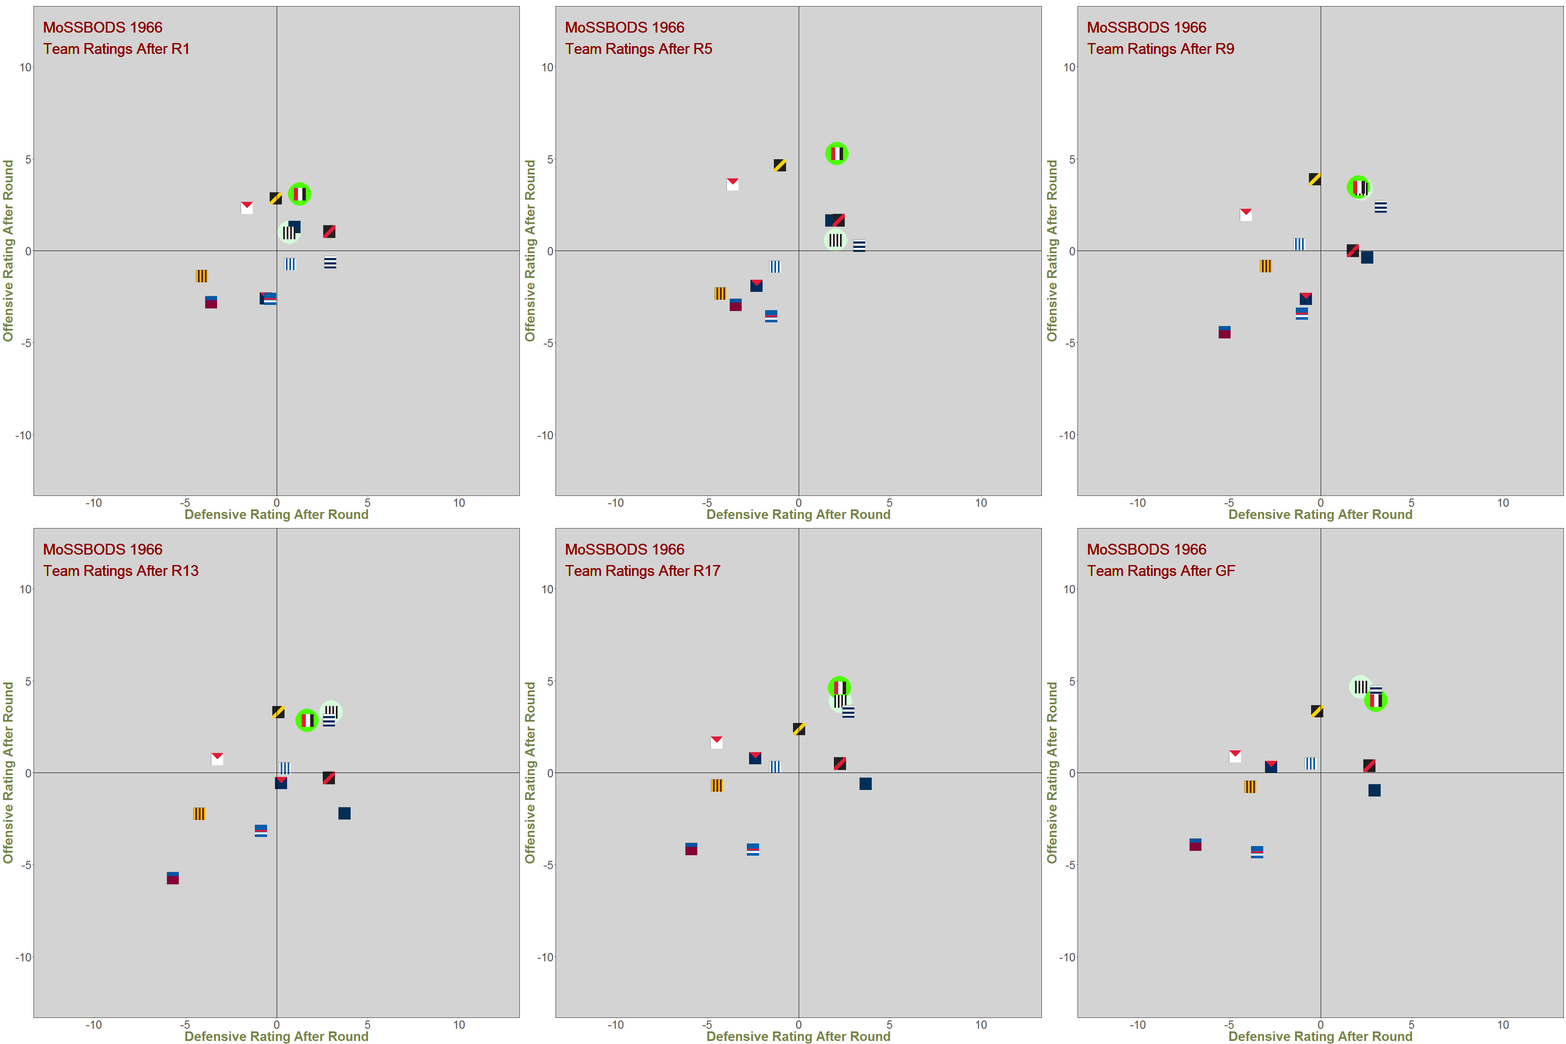
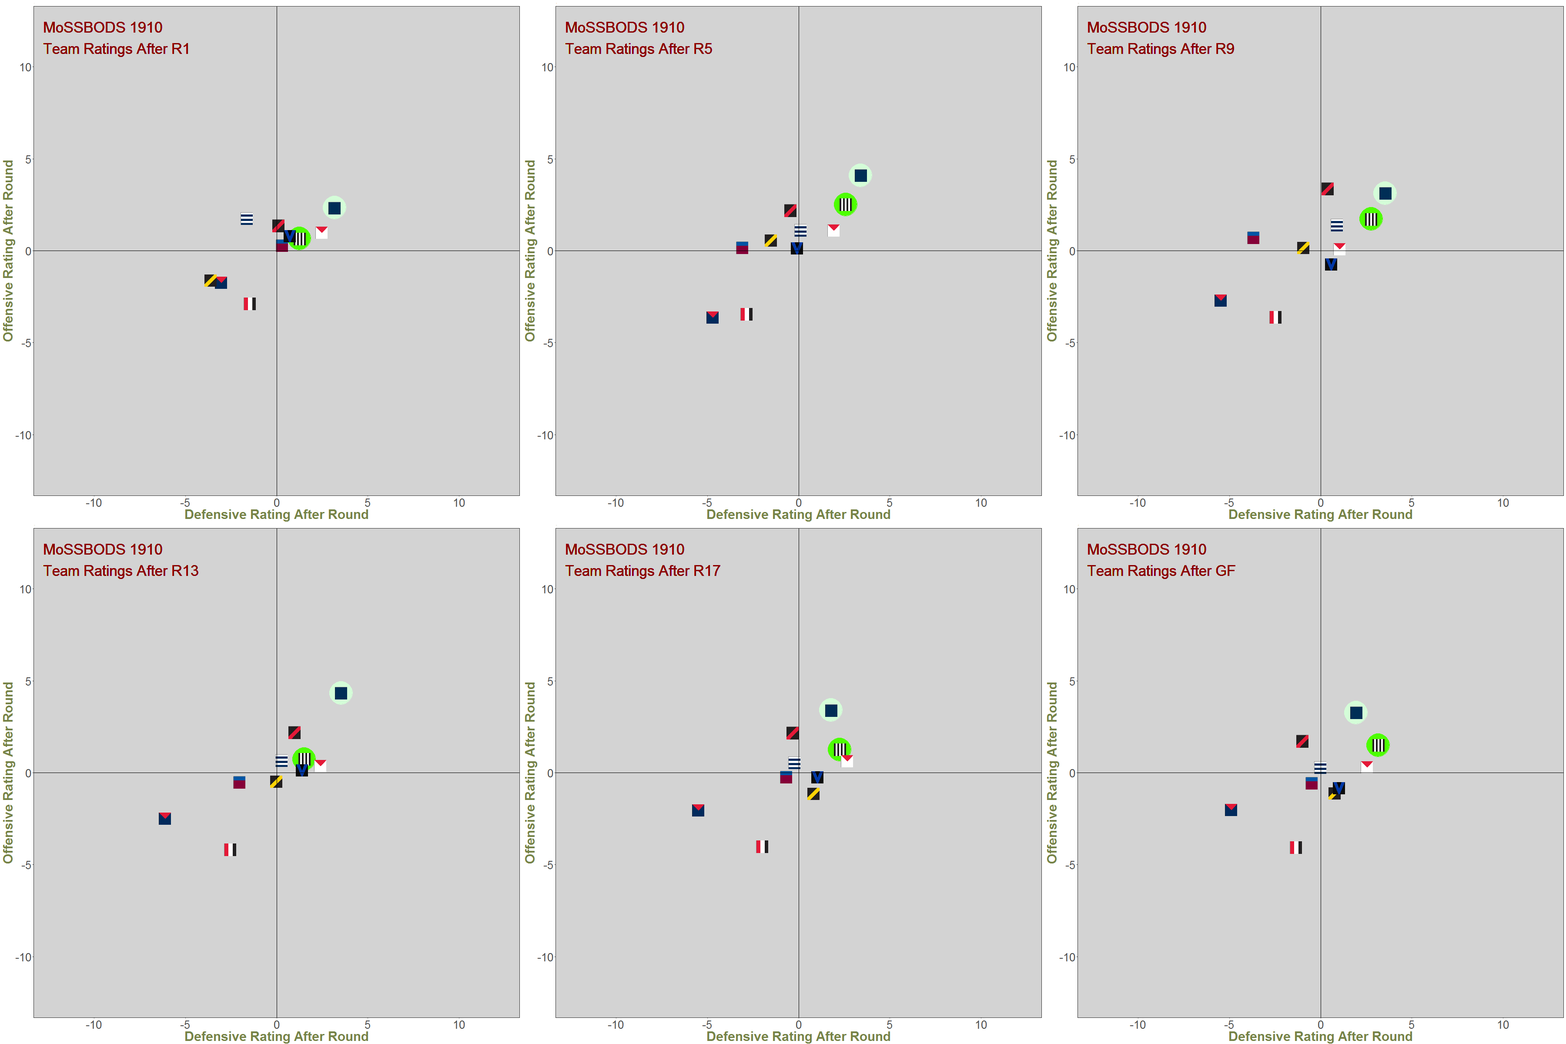
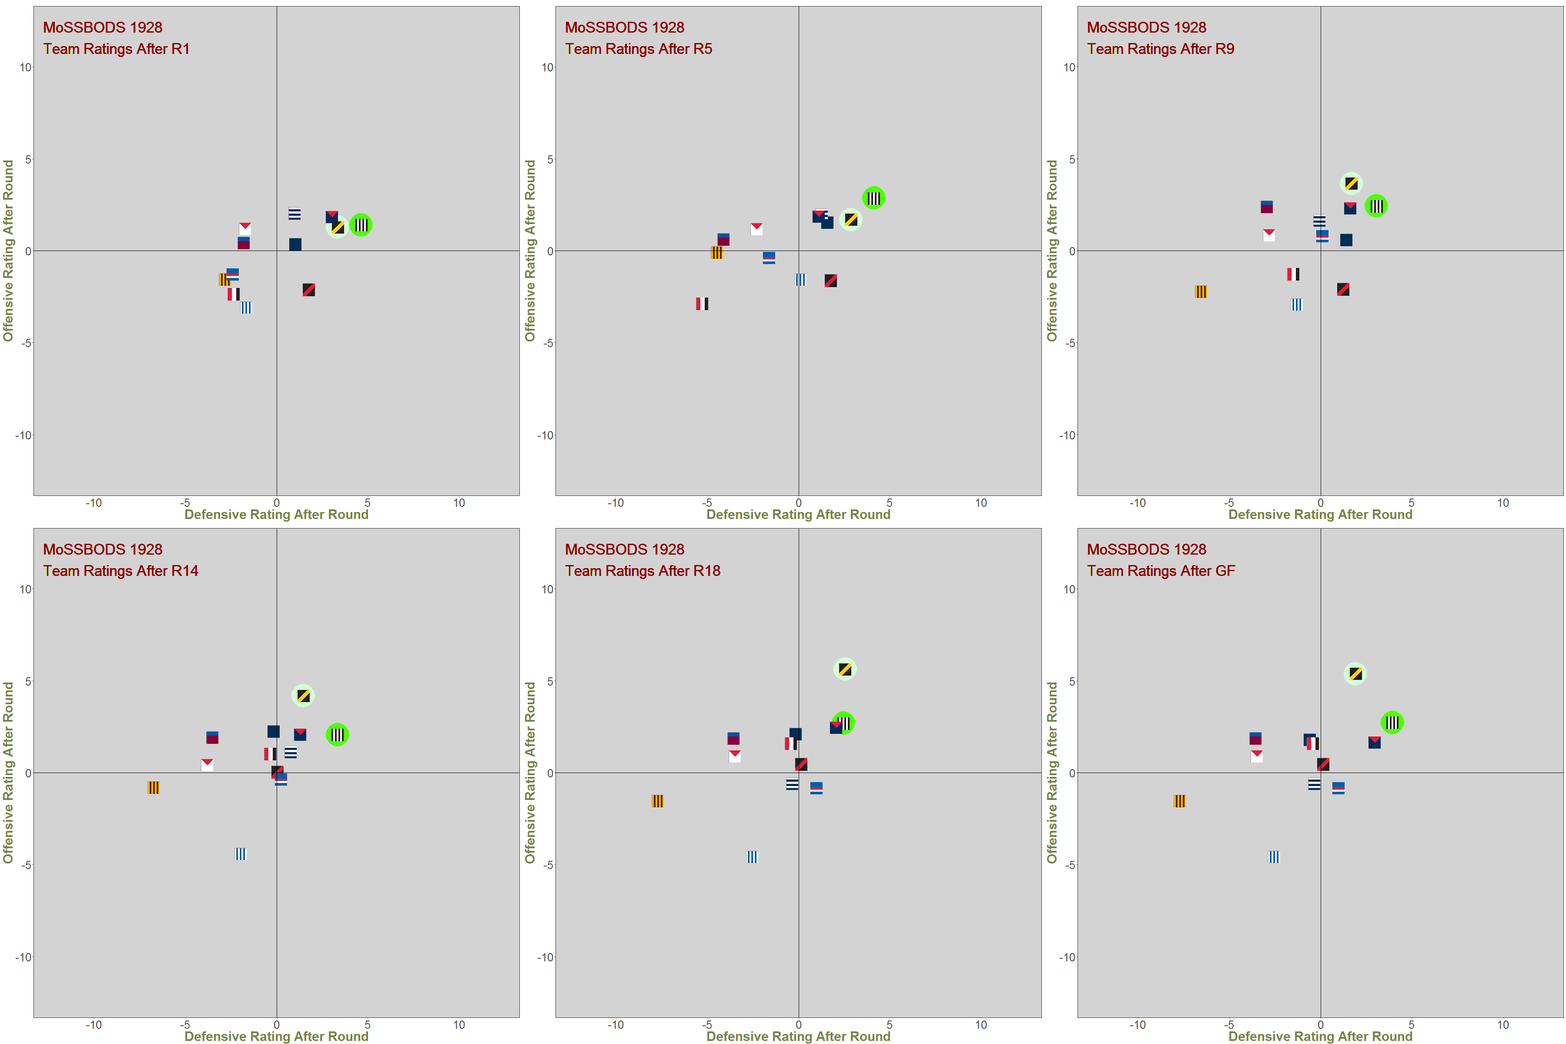
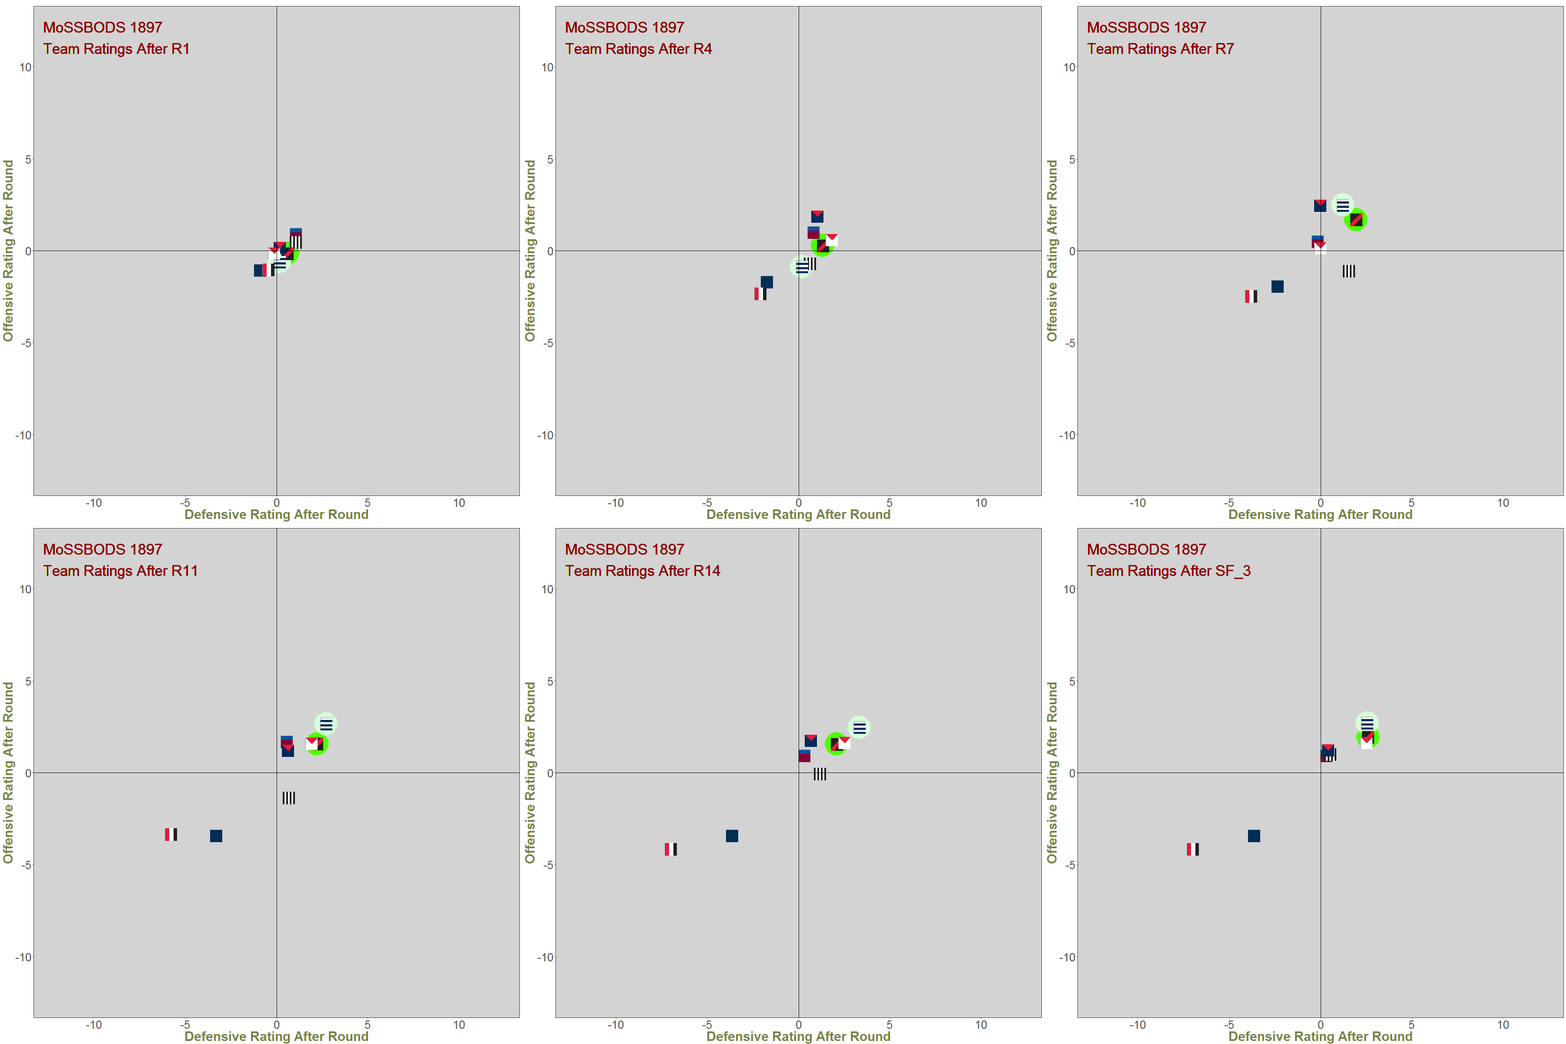
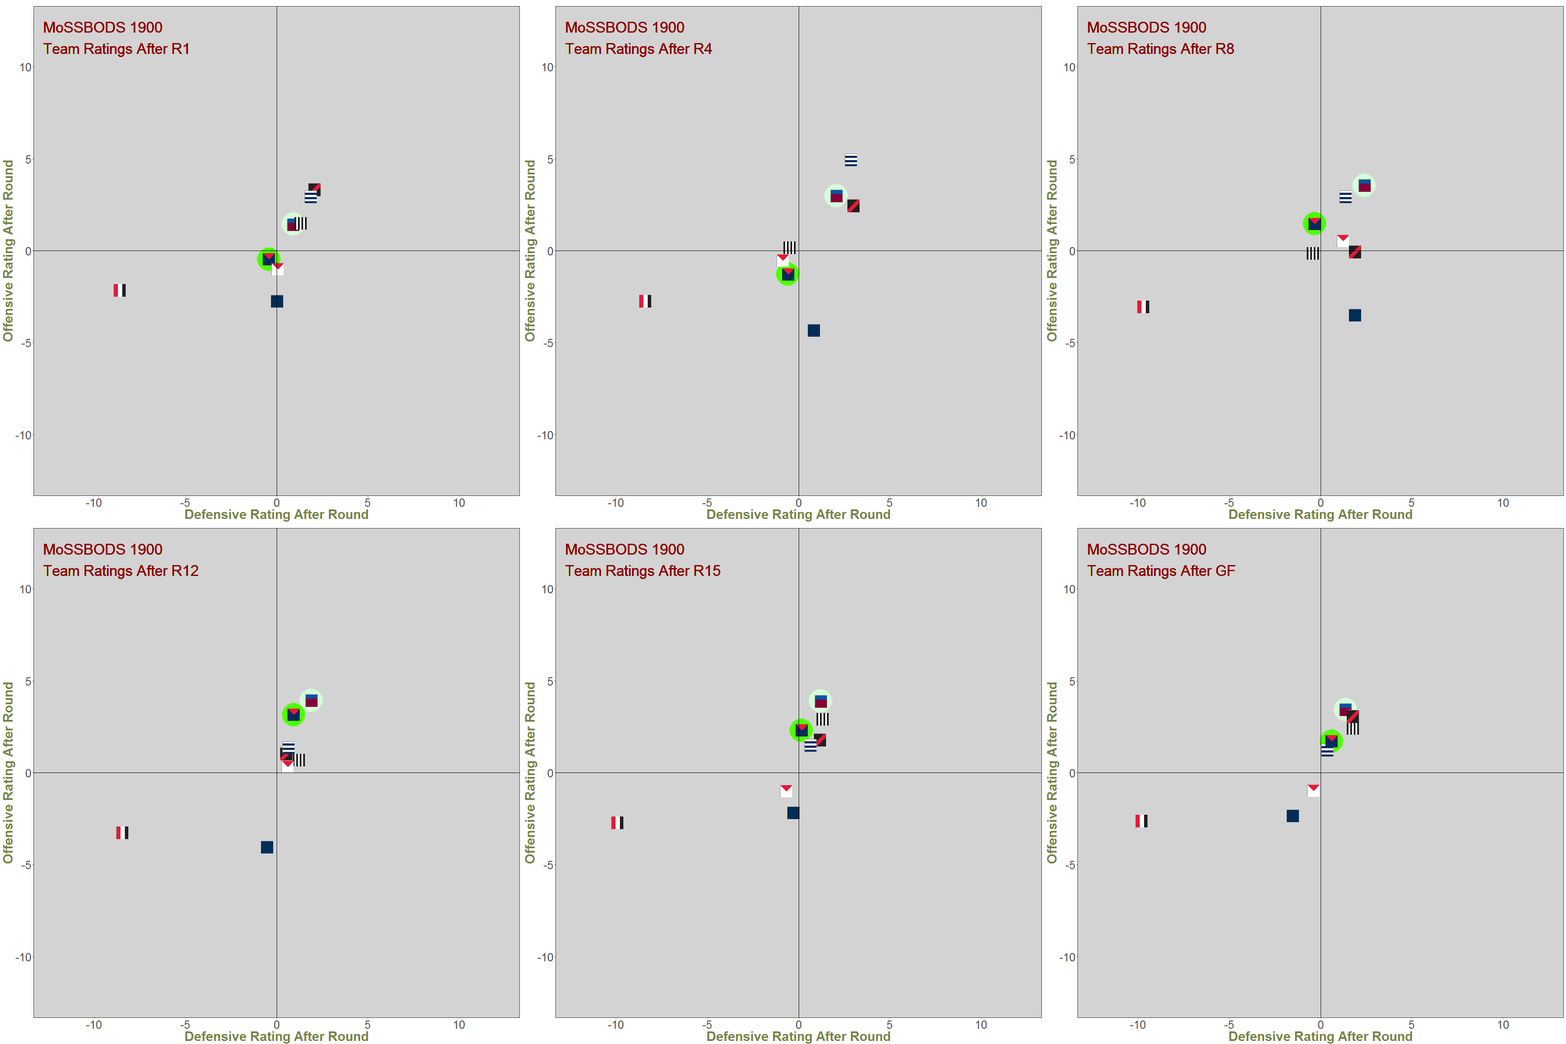
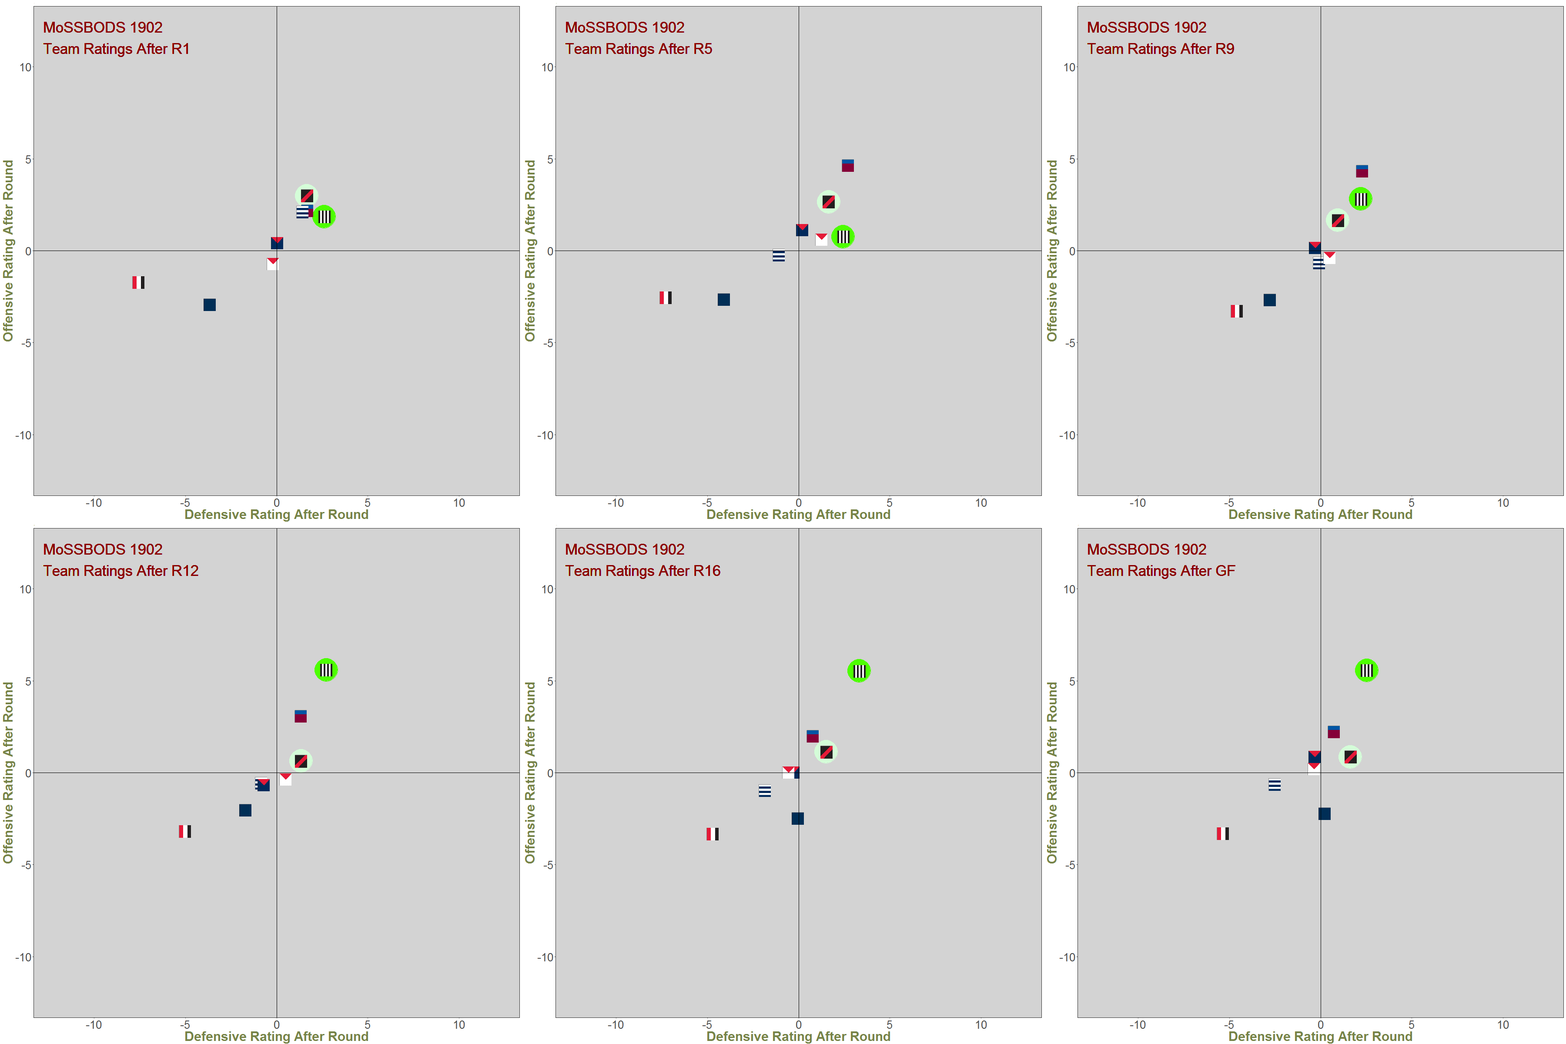
The galleries below contain MoSSBODS Team Rating progressions, round-by-round, for each completed season.
In each animation, the ultimate Premiers (bright green) and Runners Up (dull green) are highlighted.
2000-2017
1970-1999
1940-1969 1910-1939
1897-1909
THE HISTORY OF MoSSBODS RATINGS
This visualisation's a bit more complex. It's designed to show both the then-current best- and worst-ever MoSSBODS Offensive and Defensive Ratings as at the end of any specified round in VFL/AFL history. Currently, that history amounts to 2,786 rounds. These records are shown as red points, labelled with the team and year in which the record was achieved, and a rectangle is drawn for each round, bounding the best- and worst-ever Ratings to date.
The visualisation also shows the teams with the best and worst Offensive and Defensive Ratings as at end of the current round, shown in blue, with the proviso that teams are shown only if they have played in the round in question. That caveat only matters in rounds where there are byes and during the Finals, when only a subset of all teams play.
Generally then, eight points will be shown, four for the best and worst all-time Offensive and Defensive Ratings, and four more for the best and worst current Offensive and Defensive Ratings. Occasionally though, the team with the best or worst Offensive Rating will also be the team with the best of worst Defensive Rating, so fewer points will be displayed.
End of Season MoSSBODS Ratings
This visualisation shows the end-of-season MoSSBODS Team Ratings (which are measured in Scoring Shots, not Points) for every team in every year of the VFL/AFL competition.
MoSSBODS RATINGS OF PREMIERS, RUNNERS UP AND ALL OTHER TEAMS AFTER A CERTAIN NUMBER OF HOME-AND-AWAY ROUNDS
This visualisation records the Offensive and Defensive Ratings of the ultimate Premiers and Runners Up from every year (1897 to 2017), as well as the Ratings for all other teams at the same point in the season.
It shows how rapidly in a typical season the ultimate Grand Finalists emerge as teams with high Offensive and/or Defensive Ratings relative to other teams.


