2013 : Round 26 (Finals Week 3) - Results
/Some might call it luck; I'd call it justice.
Read MoreMARS is the only Rating System that I update during the Finals, the other Systems being more readily applied to the home-and-away season performances.
This weekend's results changed the ordering of five teams on the MARS Ratings Ladder, an unusually high level of activity for this time of the season.
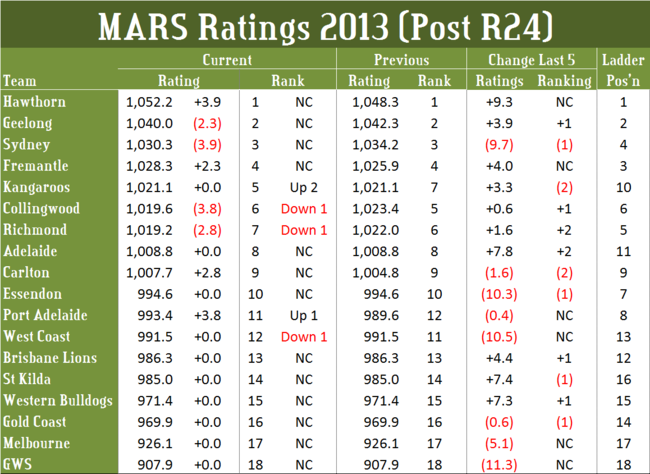 With wins next weekend, albeit unlikely in either case, Carlton have a chance to finish the season Ranked 8th on MARS, and Port Adelaide have a chance to finish 10th.
The Roos also look set to finish the season Ranked no lower than 6th and might even retain their current 5th spot if Collingwood fail to progress. That, maybe as much as anything, highlights how odd it is that the Roos aren't playing in the Finals.
Well, Investors have a wager in all four of the games from the first week of the Finals, but none will make much of a difference to the season tally since they're all SuperMargin wagers and are all, as foreshadowed in the last posting on this journal, small.
I get the sense right now, as I have done for a few weeks, that the Head-to-Head and Line Funds are playing for the final siren. As all sportslovers know, that doesn't always end well ...
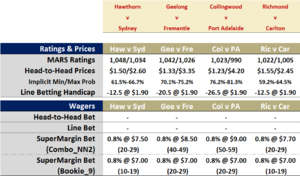 To be fair though, the Head-to-Head Fund had only two games to consider as wagering candidates this week, the home team being priced at under $1.50 in the other two contests and thus unavailable to the Fund.
The Line Fund had no such excuse but, instead, assessed the 2-and-a-bit goal start offered by the Hawks and the Tigers, the roughly 3-and-a-half-goal start offered by the Cats, and the roughly 4-and-a-half-goal start offered by the Pies as being, in each case, excessive. Frankly, I can't argue with that, especially when you consider the relatively parlous record of underdogs in Finals, a topic that I plan to cover on the Statistical Analyses journal in the next day or so.
For the most part, and certainly for those SuperMargin wagers attributable to Bookie_9, which are all price at $7, the Margin Fund's wagers are towards the conservative end of the spectrum, the boldest of the Fund's wagers being associated with Combo_NN2's view that the Pies will win by 50 to 59 points, an opinion deemed worthy only a $9 price tag by the TAB Sportsbet Bookmaker. So, we're not exactly talking "longshot" here.
With so little at stake, the week's Ready Reckoner required something of a magnifying glass to reveal the detail of the win/loss profile of each contest.
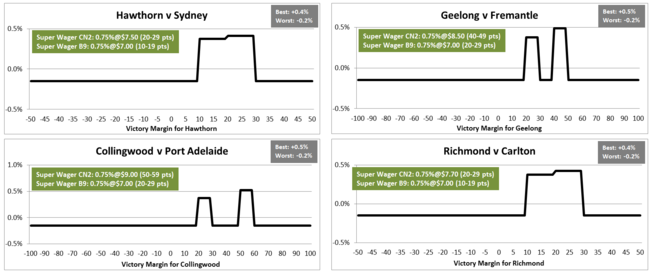 Even in an apocalyptic universe, Investors stand to lose under 1c of value and, in the utopian opposite, stand to gain just under 2c. In aggregate that's the equivalent swing that might have been associated with a single game in recent weeks.
TIPSTERS & PREDICTORS
There's not a great deal of controversy to talk about in this week's tips and predictions either.
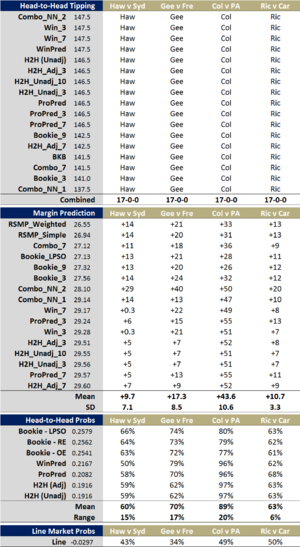 Amongst the Head-to-Head Tipsters, which this week are without the services of the Heuristic Tipsters (BKB aside), none have found reason to side with other than the home team favourites.
The Margin Predictors are similarly aligned, though the margins by which they expect the favourite to win in each game does vary somewhat. In the Hawks v Swans clash these margins range between 0.3 and 29 points, in the Cats v Dockers clash between 7 and 40 points, in the Pies v Power clash between 26 and 55 points, and in the Tigers v Blues game between 7 and 20 points.
You'll also find little argument about the outcome of each game amongst the Head-to-Head Probability Predictors, although WinPred went very close to siding with an upset Swans victory.
The Pies v Power game has generated the widest diversity of opinion across this group, with victory probability assessments for the Pies ranging from 77% to 97%. That's really more of an argument of degree than one of fundamental ideology.
Finally, turning to the Line Fund we see that its algorithm has determined that the starts imposed for the Pies and the Tigers look about right - as demonstrated by the near-50% assessments for those games - while those for the Hawks and, especially, for the Cats look manifestly excessive.
So, I'm afraid, Investors are constrained to cheering only for victory margins this week, the price we pay for aligning ourselves with a socially unaware set of algorithms. Still, those same socially-inept algorithms are also the reason we're ahead so far this season ...
Some summaries of the 2013 home-and-away season have already appeared in other blog entries but in this posting I'll be covering:
TEAM-BY-TEAM SURPRISALS
Forced to name the team whose results I'd have assessed as being, collectively, most surprising this season, I wouldn't have gone with the Blues, but they're the team whose win and loss record, relative to their pre-game TAB Sportsbet prices, has represented the highest level of surprisals per game. Essendon's results are 2nd-most surprising, and the Pies' 3rd-most. GWS' results are the least surprising of all.
(For the purposes of calculating surprisals in this table I've assessed the TAB Bookmaker's implicit probabilities by employing the Overround Equalising approach and assuming that he rated a draw as a 1% probability in every game. So, for example, if the pre-game prices were $1.58/$2.40 and the home team won, the assessed surprisal of this result would be - log2(2.40/(1.58+2.40)*0.99), which is 0.744 bits. When a draw was the final result I assessed the surprisal of that outcome as being the average of the surprisal for a home team and for an away team win.)
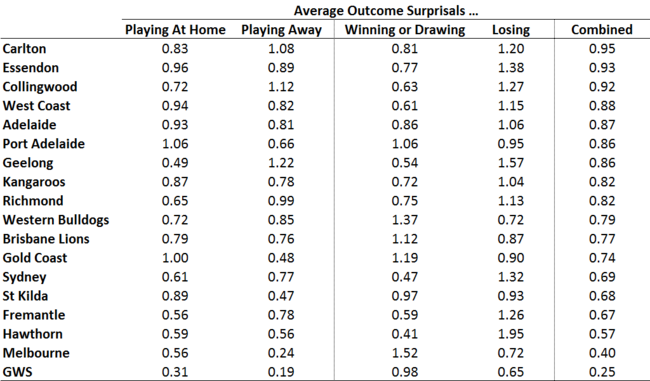 As you can see, the Blues generated more surprisals per game when they were playing away (1.08 bits per game) as compared to when they were playing at home (0.83 bits per game), and more when they lost (1.20 bits per game) than when they won (0.81 bits per game).
Port Adelaide had the most surprising set of results of all teams when playing at home, and GWS the least surprising, whilst Geelong had the most surprising away record, and GWS, again, the least surprising. It's interesting to note that Geelong, though owning the most surprising away record, also owns the second-least surprising home record.
Viewing surprisals instead from the perspective of whether a team won (or drew) or lost, we find that Melbourne's wins were, on average, the most surprising and Hawthorn's the least, while Hawthorn's losses were the most surprising and GWS' the least.
WINNING RATE BY LEAD AT QUARTER BREAKS
This season, teams that led at Three-Quarter Time when on to win 86% of the time, while those that led at Half Time won 78% of the time, and those that led at Quarter Time won just 69% of the time. Those rates are all lower than the equivalent rates for last season but higher than the equivalent rates for 2011.
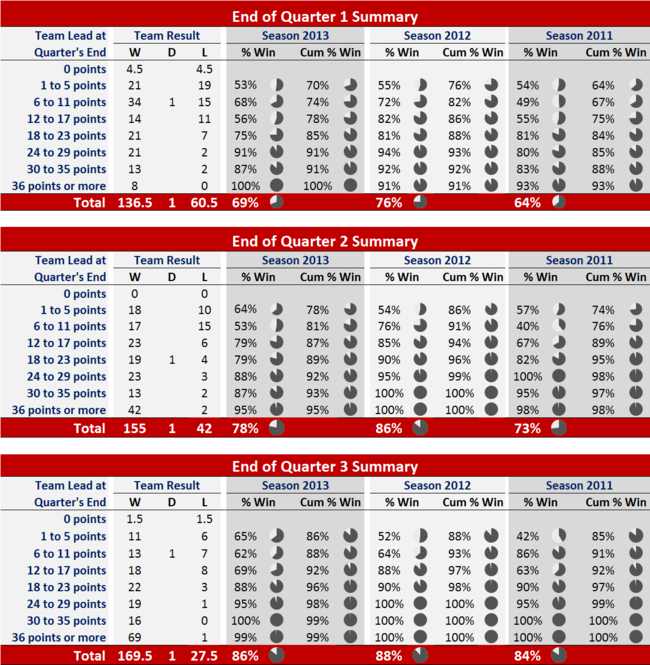 To be 90% certain of victory this year, teams needed to lead by 4 goals or more at Quarter Time, 4 goals or more at Half Time, and 2 goals or more at Three-Quarter Time (for this data refer to the columns headed "Cum % Win", which provide the proportion of teams that went on to win, in those games where there was a clear leader at the break, when they held a lead equal to or greater than the range shown in the row heading. So, for example, 74% of teams that led by 6 points or more at Quarter Time in games where there was a clear leader at that point in the game, went on to win). The equivalent required leads in 2012 were 4 goals, 1 goal and 1 goal so, in short, teams did a better job of running down leads in 2013 than they did in 2012.
SCORING AND KICKING ACCURACY BY ROUND
Once more this season, consistent with VFL/AFL history, winning teams registered a little over 60% of all goals and about 58% of all scoring shots. Round 10 was the round in which winning teams dominated most in terms of goals scored, registering about two-thirds of the final total, while Round 18 saw winning teams grab their largest share of all scoring shots, 64%.
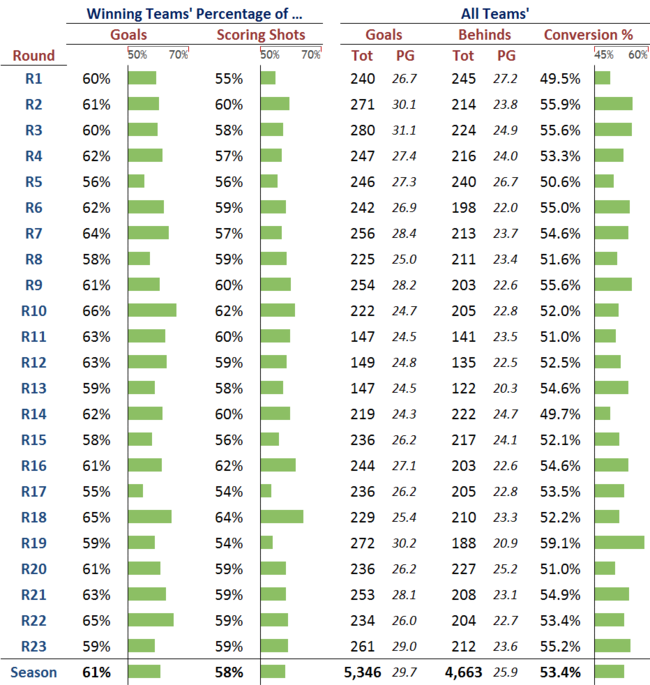
In terms of shear scoring, Round 3 was the high point, producing 31.7 goals per game, while Round 1 was the provider of bounteous behinds, offering up over 27 per game while the teams' major kickers were still, literally, finding their range.
The behind-a-thon that was Round 1 was, unsurprisingly, the round with the poorest scoring shot conversion rate all year at just 49.5%, though Round 14's 49.7% wasn't much better. The high point for conversion was Round 19's 59.1%.
WAGERING RESULTS BY TEAM AND BY WAGER TYPE
If a picture paints a thousand words then perhaps it's best I start this section with a chart representation of each team's wagering performance so far this season.
Looking first at each team's wagering return when MAFL has been wagering on them, just five teams stand out as having generated significant returns to Investors: Adelaide (due mainly to Head-to-Head and Line wagers), Geelong (due mainly to Line and SuperMargin wagers), the Roos (due mainly to Line wagers), Port Adelaide (due mainly to Head-to-Head but also, a little, to SuperMargin wagers), and Sydney (due almost entirely to Line wagers).
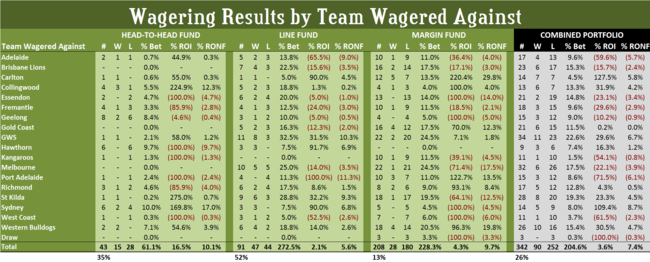
The major losses have occurred when MAFL has wagered on Collingwood, Fremantle, Richmond and St Kilda, though other teams have also contributed to losses, these having been spread more evenly across a wider range of teams.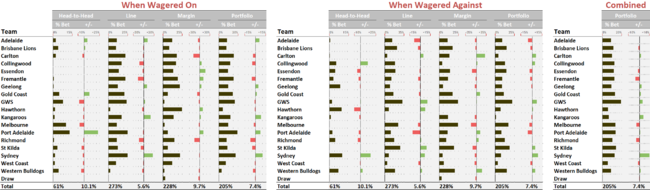 Looking instead at the returns to MAFL when a team has been wagered against we find that six teams stand out as providers of positive ROI (Carlton, Collingwood, GWS, St Kilda, Sydney and the Western Bulldogs) while four are responsible for a significant proportion of losses (Adelaide, Essendon, Melbourne and Port Adelaide). Again though we find that losses are spread more widely and thinly across teams than are gains.
Combining the "wagering on" and "wagering against" views we find that GWS, the Roos and Sydney are the major contributors to Investor wealth, while Fremantle, Melbourne and Richmond have been more of the TAB Bookmaker's ally.
For those of you who prefer tables to charts, here's the underlying data:
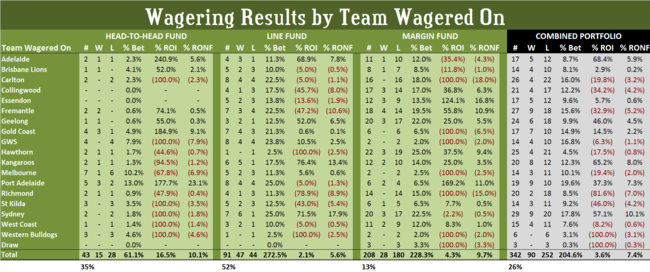
 One extra thing you might take away from these tables is the fact that the funds in the Head-to-Head Fund have turned only 0.6 times so far this season, while those in the Line Fund have turned 2.7 times, and those in the Margin Fund have turned 2.3 times. Overall that means every dollar in the Recommended Portfolio has been in the TAB Bookmaker's hands a little over twice. Fortunately, so far this season, he's had to give every one of those dollars back plus a little over 7% of Investors' original stake.
In a typical week, the TAB Sportsbet Bookmaker posts his initial Head-to-Head markets on Monday at Noon and then, progressively, after Noon on Wednesday significantly reduces the overround on those Head-to-Head prices and posts the Line, SuperMargin and other markets.
But, this has been anything but a typical week in AFL history and, reflecting that, it's been anything but a typical week on TAB Sportsbet.
As I type this, no markets at all exist on the TAB for the Dons v Tigers game, and all but the Head-to-Head markets for the Saints v Freo game are suspended, after an extraordinary afternoon that saw a Line market posted with the Saints receiving 33.5 points start, priced at the usual $1.90/$1.90 only to be savaged by the punters in the first 20 minutes, so much so that the pricing was adjusted to $1.68/$2.20 before the dust had even considered settling and that market too was suspended.
Consequently, the wagers and tips that I'll be describing in this post should be considered preliminary, in the sense that I might add wagers on any of the Head-to-Head, Line or SuperMargin markets for the Dons v Tigers game should any eventual pricing seem propitious, and that I might add a Line bet on the Saints if my current estimate of a 20.5 point handicap proves prescient. As well, I'll update the Head-to-Head Tipsters, and Margin and Probability Predictors prognostications for these games as appropriate.
In terms of wagers, here's what Investors have locked in:
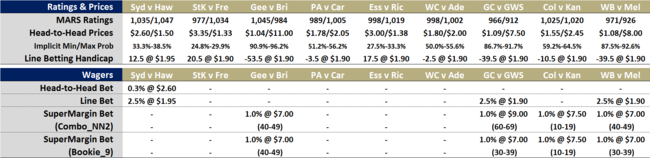
(Note that I've shown here markets for the Essendon v Richmond game, which I've based on the actual Head-to-Head market currently available at www.sportsbet.com.au and the Line market that such pricing would imply should the TAB Sportsbet Bookmaker adopt those prices, and a Line market for the St Kilda v Fremantle game, which I've inferred from the current, actual TAB Sportsbet Head-to-Head market.)
No matter what else happens over the next few days, here are what those wagers mean for Investors:
 It is, therefore, the start and the end of the round that matters, with all five games in which we've currently an interest offering upsides in the 1.2% to 2.1% range and downsides in the -0.2% to -1.7% range. Frankly, it's comforting to me to have a low egg-to-basket ratio in the current footballing climate.
TIPSTERS AND PREDICTIONS
Just as the wagering is subject to change for the Saints v Fremantle and Dons v Tigers games, so too should the tips and predictions for those two games be considered preliminary unless and until such time as the markets for those games are resolved.
Given what we know so far though, here are the Head-to-Head Tipster predictions, which will only change if a Head-to-Head market for the Essendon v Richmond game materialises and is significantly different from what I've assumed:
 Only in the Port Adelaide v Carlton game is there substantive disagreement and, amongst the remaining games, only in the Adelaide v West Coast game is there more than token dissention. Still, Home Sweet Home has managed to make selections that are, on average, almost 50% different from its peers.
It's interesting to note also that the best-performed Tipsters have tipped against the favourites in two games, opting for the Blues over Port, and for the Crows over the Eagles.
The Margin Predictors are divided only over the same two games, with the majority also supporting the Blues but with an 8-8 split in the Eagles v Crows game. Based on average predicted margin, for the Margin Predictors, as for the Head-to-Head Tipsters, the Crows have it.
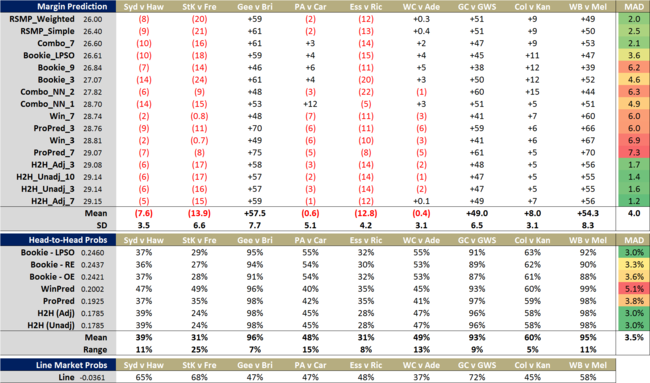
For the first time since I can remember, the standard deviation of the Margin Predictors' margin predictions is single digit in every game.
The Head-to-Head Probability Predictors are a bit less collegiate, especially in the Saints v Freo game (which is subject to amendment) where estimates of the Saints' chances range from 24% to 49%. In four other games - Sydney v Hawthorn, Port Adelaide v Carlton, West Coast v Adelaide, and Western Bulldogs v Melbourne - the difference between the high and low assessments of the home team's chances slip into double digits.
In four games this week, the Line Fund algorithm rates the line betting chances of one of the teams as 60% or better : the Swans (65%), the Saints (68%, though only if they receive the 20.5 points start I'm expecting), Adelaide (63%), and Gold Coast (72%). It's these four games that will mostly determine the probability score for the algorithm for this round.
MAFL is a website for ...
![]() Click on the envelope
Click on the envelope
Copyright © 2006-2023, Tony Corke. All rights reserved.
