2013 : A Review of the Home-and-Away Season
/Some summaries of the 2013 home-and-away season have already appeared in other blog entries but in this posting I'll be covering:
- Team-by-team surprisals
- The winning rate of teams with leads of various magnitudes at each of the quarter breaks
- Team scoring and conversion rates by round
- The MAFL Funds' wagering records for each team
TEAM-BY-TEAM SURPRISALS
Forced to name the team whose results I'd have assessed as being, collectively, most surprising this season, I wouldn't have gone with the Blues, but they're the team whose win and loss record, relative to their pre-game TAB Sportsbet prices, has represented the highest level of surprisals per game. Essendon's results are 2nd-most surprising, and the Pies' 3rd-most. GWS' results are the least surprising of all.
(For the purposes of calculating surprisals in this table I've assessed the TAB Bookmaker's implicit probabilities by employing the Overround Equalising approach and assuming that he rated a draw as a 1% probability in every game. So, for example, if the pre-game prices were $1.58/$2.40 and the home team won, the assessed surprisal of this result would be - log2(2.40/(1.58+2.40)*0.99), which is 0.744 bits. When a draw was the final result I assessed the surprisal of that outcome as being the average of the surprisal for a home team and for an away team win.)
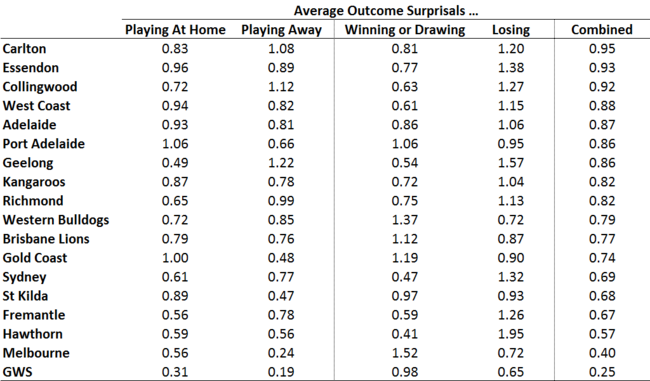 As you can see, the Blues generated more surprisals per game when they were playing away (1.08 bits per game) as compared to when they were playing at home (0.83 bits per game), and more when they lost (1.20 bits per game) than when they won (0.81 bits per game).
Port Adelaide had the most surprising set of results of all teams when playing at home, and GWS the least surprising, whilst Geelong had the most surprising away record, and GWS, again, the least surprising. It's interesting to note that Geelong, though owning the most surprising away record, also owns the second-least surprising home record.
Viewing surprisals instead from the perspective of whether a team won (or drew) or lost, we find that Melbourne's wins were, on average, the most surprising and Hawthorn's the least, while Hawthorn's losses were the most surprising and GWS' the least.
WINNING RATE BY LEAD AT QUARTER BREAKS
This season, teams that led at Three-Quarter Time when on to win 86% of the time, while those that led at Half Time won 78% of the time, and those that led at Quarter Time won just 69% of the time. Those rates are all lower than the equivalent rates for last season but higher than the equivalent rates for 2011.
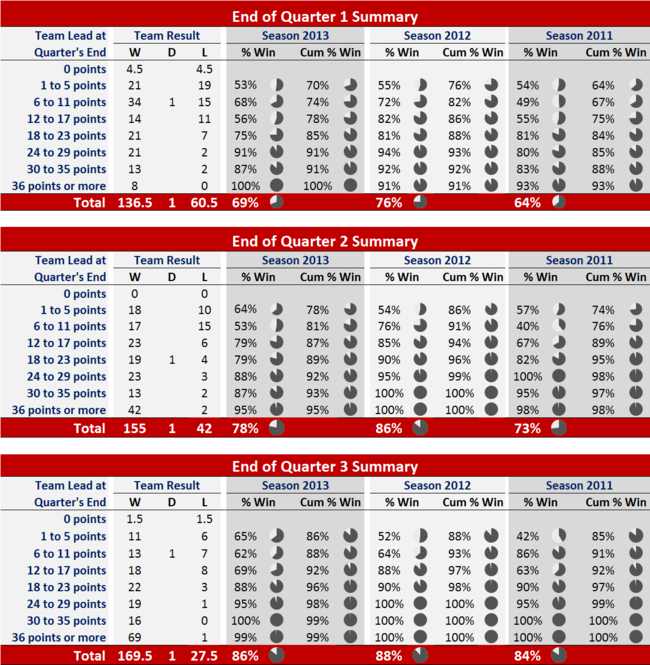 To be 90% certain of victory this year, teams needed to lead by 4 goals or more at Quarter Time, 4 goals or more at Half Time, and 2 goals or more at Three-Quarter Time (for this data refer to the columns headed "Cum % Win", which provide the proportion of teams that went on to win, in those games where there was a clear leader at the break, when they held a lead equal to or greater than the range shown in the row heading. So, for example, 74% of teams that led by 6 points or more at Quarter Time in games where there was a clear leader at that point in the game, went on to win). The equivalent required leads in 2012 were 4 goals, 1 goal and 1 goal so, in short, teams did a better job of running down leads in 2013 than they did in 2012.
SCORING AND KICKING ACCURACY BY ROUND
Once more this season, consistent with VFL/AFL history, winning teams registered a little over 60% of all goals and about 58% of all scoring shots. Round 10 was the round in which winning teams dominated most in terms of goals scored, registering about two-thirds of the final total, while Round 18 saw winning teams grab their largest share of all scoring shots, 64%.
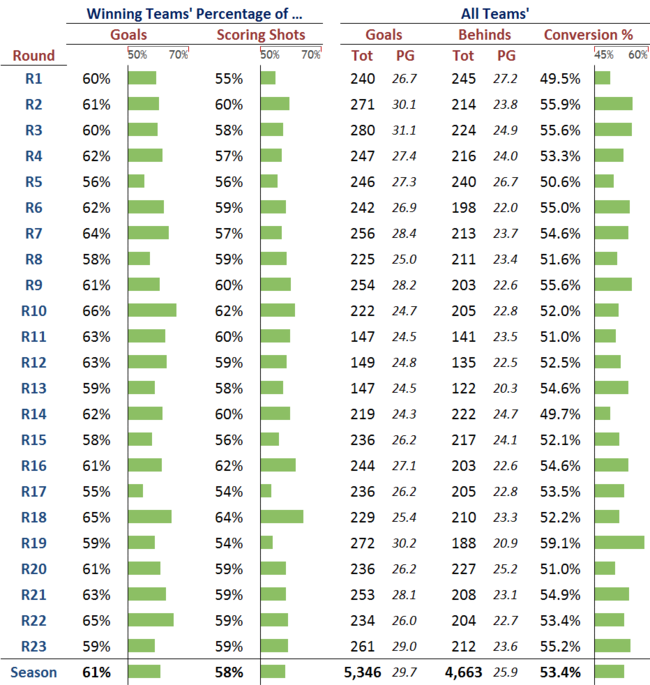
In terms of shear scoring, Round 3 was the high point, producing 31.7 goals per game, while Round 1 was the provider of bounteous behinds, offering up over 27 per game while the teams' major kickers were still, literally, finding their range.
The behind-a-thon that was Round 1 was, unsurprisingly, the round with the poorest scoring shot conversion rate all year at just 49.5%, though Round 14's 49.7% wasn't much better. The high point for conversion was Round 19's 59.1%.
WAGERING RESULTS BY TEAM AND BY WAGER TYPE
If a picture paints a thousand words then perhaps it's best I start this section with a chart representation of each team's wagering performance so far this season.
Looking first at each team's wagering return when MAFL has been wagering on them, just five teams stand out as having generated significant returns to Investors: Adelaide (due mainly to Head-to-Head and Line wagers), Geelong (due mainly to Line and SuperMargin wagers), the Roos (due mainly to Line wagers), Port Adelaide (due mainly to Head-to-Head but also, a little, to SuperMargin wagers), and Sydney (due almost entirely to Line wagers).
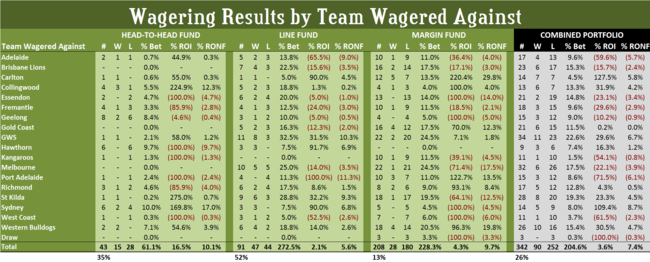
The major losses have occurred when MAFL has wagered on Collingwood, Fremantle, Richmond and St Kilda, though other teams have also contributed to losses, these having been spread more evenly across a wider range of teams.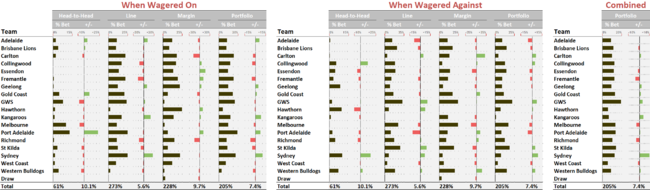 Looking instead at the returns to MAFL when a team has been wagered against we find that six teams stand out as providers of positive ROI (Carlton, Collingwood, GWS, St Kilda, Sydney and the Western Bulldogs) while four are responsible for a significant proportion of losses (Adelaide, Essendon, Melbourne and Port Adelaide). Again though we find that losses are spread more widely and thinly across teams than are gains.
Combining the "wagering on" and "wagering against" views we find that GWS, the Roos and Sydney are the major contributors to Investor wealth, while Fremantle, Melbourne and Richmond have been more of the TAB Bookmaker's ally.
For those of you who prefer tables to charts, here's the underlying data:
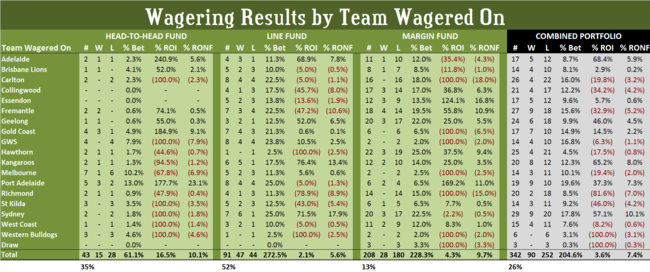
 One extra thing you might take away from these tables is the fact that the funds in the Head-to-Head Fund have turned only 0.6 times so far this season, while those in the Line Fund have turned 2.7 times, and those in the Margin Fund have turned 2.3 times. Overall that means every dollar in the Recommended Portfolio has been in the TAB Bookmaker's hands a little over twice. Fortunately, so far this season, he's had to give every one of those dollars back plus a little over 7% of Investors' original stake.
