Probability Score as a Predictor of Profitability : A More General Approach
/We've spent some time now working with the five parameter model, using it to investigate what various wagering environments mean for the relative and absolute levels of profitability to Kelly-staking and Level-staking.
The course we followed in the simulations for the earliest blogs was to hold some of the five parameters constant and to vary the remainder. We then used the simulation outputs to build rules of thumb about the profitability of Kelly-staking and of Level-staking. These rules of thumb were described in terms of the values of the parameters that we varied, which made them practically useful only if we felt we could estimate quantities such as the Bookie's and the Punter's bias and variability. The exact values of these parameters cannot be inferred from an actual set of bookmaker prices, wagers and results because they depend on knowledge of the true Home team probability in every game.
More recent blogs have provided rules based on probability scores, which are directly related to the underlying value of the bias and variability of the bookie or punter that produced them, but which have the decided advantage of being directly measurable.
Whilst the rules from these later blogs are undoubtedly more practical than those we generated in the earlier blogs, they are nonetheless based on only a single value of bookie bias (0%) and a single value of bookie sigma (5%). As such they are strictly only applicable in situations where these or very similar values of bookie bias and sigma prevail - which, in the absence of knowledge about true Home team probabilities, we can never determine (and which is why we moved to the use of probability scores in the first place).
What we need do is generate similar rules using probability scores but based on a broader range of values for bookie bias and sigma - a range sufficient to cover all likely values of the relevant parameters that might be encountered in the real worls. That's what I've done for this blog where we have:
- Bookie bias selected at random from the range -5% to +5%
- Bookie sigma selected at random from the range 0% to 10%
- Punter bias selected at random from the range -10% to +10%
- Punter sigma selected at random from the range 0% to 10% (frankly, if it's any larger than 10%, you might as well be wagering with a random number generator)
- Home team probabilities generated using the equation from this blog but with a random perturbation of between -5% and +5%
- Overround held fixed at 107.5%
In this more general world it's no longer sufficient to couch rules in terms of the ratio of punter to bookie probability scores. Instead, it makes more sense to fit equations that predict wagering ROI as a function of punter and bookie probability scores.
Here's a chart of the equation fitted to the expected ROI from Kelly-staking:
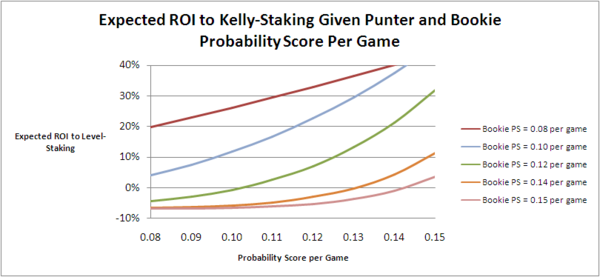
(The fitted equation is 0.380*(0.726 + 0.0321*Punter.Prob.Score - 0.0276*Bookie.Prob.Score)^(0.504*Bookie.Prob.Score - 5.926) - 0.0683, the R-squared for which is about 80%. This equation correctly predicts whether or not a given pair of punter and bookie probability scores will result in a profit or loss to the punter from Kelly-staking in about 83% of the simulations.)
From this chart you can see that, the higher the bookmaker's probability score, the closer must be the punter's probability score to the bookmaker's if the expected profit is to be positive. If the bookie's probability score is only 0.10 per game then a punter with a probability score of 0.08 per game can expect to earn a about a 5% ROI from Kelly-staking. In contrast, if the bookie's probability score is 0.15 per game then a punter with a probability score of 0.14 per game can expect to lose money.
Next, let's consider the equivalent chart for Level-staking:
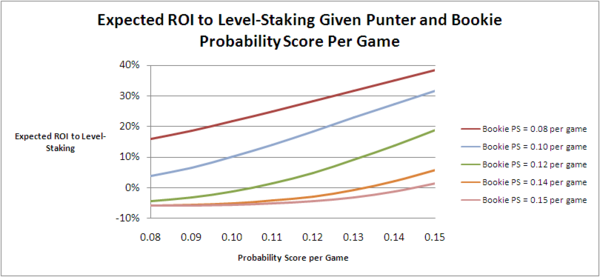
(The fitted equation is 0.0174*Punter.Prob.Score*logistic(5.809 + (118.624/Punter.Prob.Score - Bookie.Prob.Score)/(0.112*Punter.Prob.Score)) - 0.059, the R-squared for which is about 75%. This equation correctly predicts whether or not a given pair of punter and bookie probability scores will result in a profit or loss to the punter from Level-staking in about 85% of the simulations.)
Here too, as we saw for Kelly-staking, we can see that the higher the bookmaker's probability score the closer must be the punter's probability score to the bookmaker's if an expected profit is to be achieved.
If we combine the two equations and use them to determine when Level-staking is superior to Kelly-staking we find that, for the broad range of wagering environments we've considered in the simulations for this blog, Level-staking is only more profitable than Kelly-staking when the Punter's performance (as measured by her probability score) is poor relative to the Bookie's, so poor in fact that the expected ROI from Kelly-staking and from Level-staking is negative.
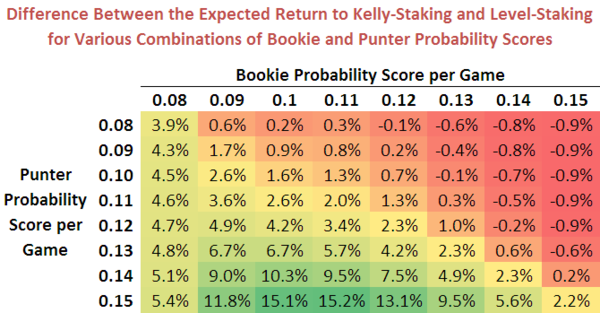
This suggests, as broadly has been suggested in the rules we've found from simulations in the earlier blogs, that Level-staking is preferable only when a punter is relatively poorly calibrated, as a means of reducing the expected loss from wagering.
(An accurate way to predict the likelihood that the ROI from Kelly-staking will exceed that from Level-staking is to take the difference between the predicted ROI from Kelly-staking and that from Level-staking for a given combination of Punter and Bookie probability scores. This correctly predicts which of the two staking methods produces the higher ROI for almost three-quarters of the simulations.)
