2011 Round 2 Results: A Round of Learning

Well that's settled a few things. The Gold Coast weren't a 1,000 MARS-Rated team at the start of the weekend (and they certainly aren't now), games where the line is under 6.5 points do seem as though they'll be tricky propositions this seasons, Investors aren't going to enjoy a season of unremitting joy, and if it's truly the mean we've just regressed to, I don't want any part of it.
Read More

2011 Round 2 : Regress and Regret or Consolidate and Confirm?

Often we make implicit decisions even when we kid ourselves that we're not making a decision at all - we're just letting "nature take its course". For example, I heard the other day about the Principle of Indifference, which states that, in the absence of evidence to the contrary, all possible outcomes of an event should be treated as equally likely. This sounds to me like an invitation to be fleeced by somebody who has greater knowledge about an event than you do and who is willing to frame a market to take advantage of this - a situation that is sometimes referred to an information asymmetry. The decision not to change from an otherwise predestined course of action is a decision not to change from that predetermined course. And the decision not to change the default initial rating for a footy team is a decision to apply the default initial rating to that team.
Read More

A Few Tweaks to the Head-To-Head Fund

Over the past week or so I've been analysing in detail the performance of ProPred, WinPred and the Head-to-Head Fund across seasons 2007 to 2010. I'll be writing more about what I've found for ProPred and WinPred on the Statistical Analyses blog, but here I want to explain what I've found for the Head-to-Head Fund, which previously I'd evaluated mainly on its 2009 and 2010 performances, and how I've tweaked the Fund's wagering rules as a result.
Read More

Heuristics V2.0 - Still Worth Following?

As I noted in the previous blog, when I rebuilt the heuristics to cater for the bye, I made a few other what I thought were subtle changes to some of the building block rules on which they're built. My assumption was that these changes would have had minimal effect on the tipping accuracy of each heuristic and, to be honest, I didn't even consider whether it would effect their wagering performance.
Read More

MAFL 2010 : Round 27 Results (GF 2.0)

If MARS Ratings are to be believed, the right team won on Saturday.

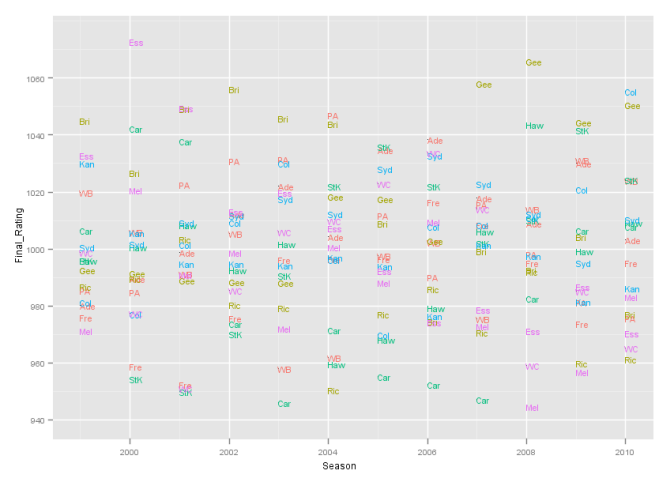
In winning so emphatically, Collingwood lifted its MARS Rating by 3.7 points to finish the season rated 1,055.4, which rates it above the Geelong of 2009 (1,044.5) but below the Geelongs of 2008 (1,065.9) and 2007 (1,058.3). Prior to that, the only teams with a higher end-of-season MARS Rating since 1999 were the Lions of 2002 (1,056.2) and the Dons of 2000 (1,072.7).

The following graphic shows the end-of-season ratings for every team over the seasons 1999 to 2010.

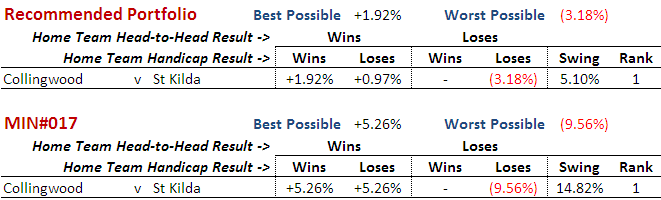
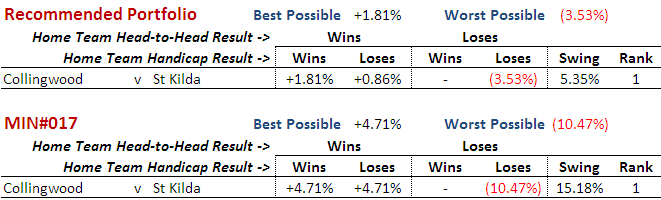
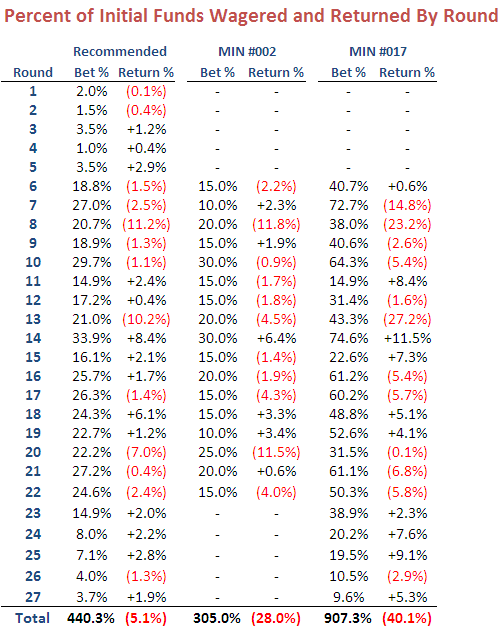
The Pies' victory more than recompensed all still-active Investors for what they lost last weekend. The Recommended Portfolio rose by 1.9% and finished the season down by just 5.1%, while MIN #017's Portfolio rose by 5.3% to end the season down by 40.1%. MIN #002's Portfolio, which was 100% weighted to the Shadow Fund, lost 28%.

(A final reconciliation of Fund performance uncovered a discrepancy of 0.7% in favour of the Recommended Portfolio. This has been reflected in the figure above.)

Both the Portfolios that were active during the Finals made money over these 5 weeks, as you can see in the following graphic.

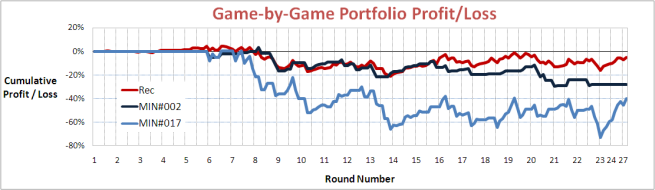
Another couple of weeks of Finals and you have to wonder if the Recommended Portfolio might finally have broken through into profitability. If any of you are stock markets chartists you might have a view on this - please let me know.

A look at the round-by-round view for each Portfolio shows that it was Rounds 8 and 13 that did much of the damage to all Portfolios, though Round 20 also wasn't kind to MIN #002's Portfolio and MIN #017 could have done without Round 7.

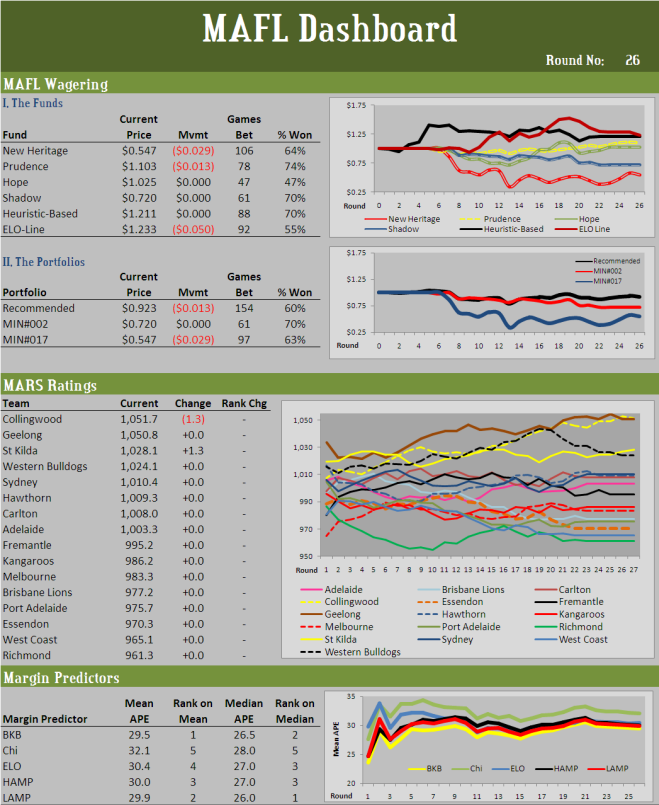
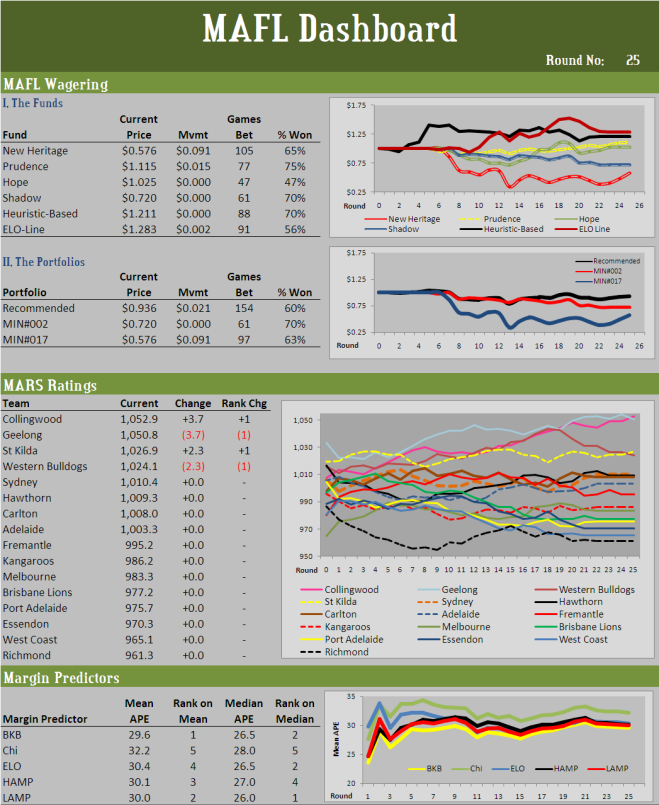
Here's the final dashboard for 2010.

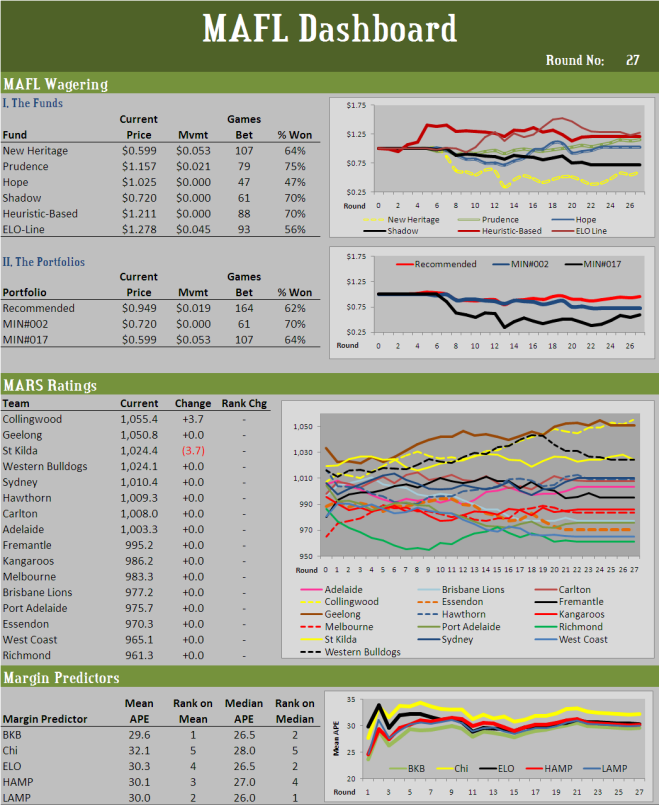
Four of the six MAFL Funds wound up making a profit this year,with ELO the best of them making almost 28%, followed by Heuristic-Based making a little over 21%. Then came Prudence, which returned almost 16%, and Hope, which made 2.5%. The two losing Funds were Shadow, which lost 28%, and New Heritage, which lost just over 40%.

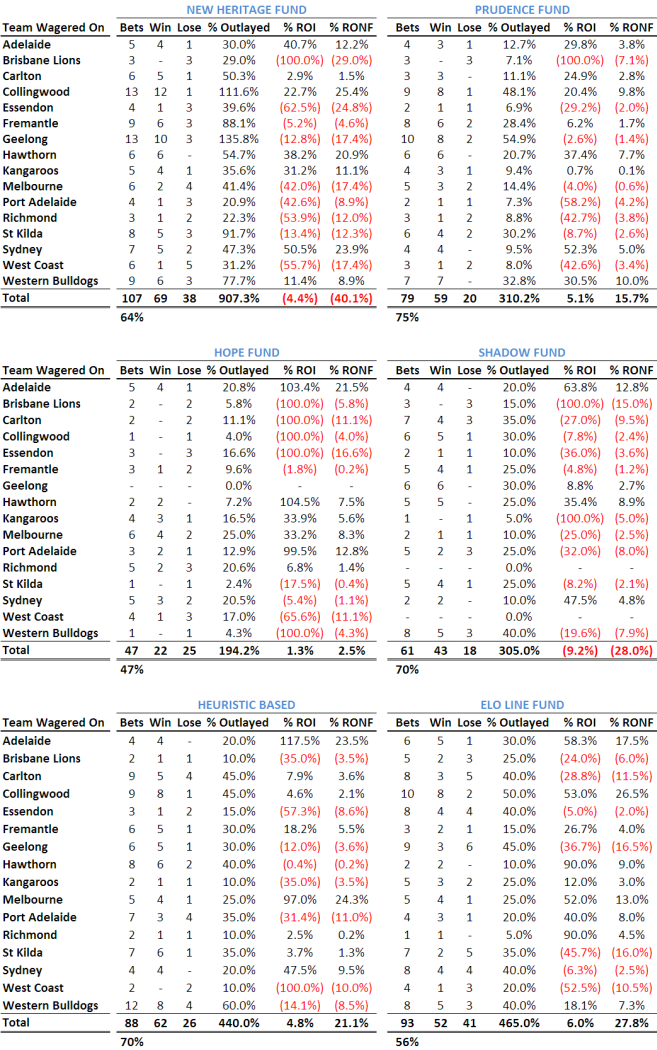
We can decompose those performances in a number of ways, firstly by team wagered on.

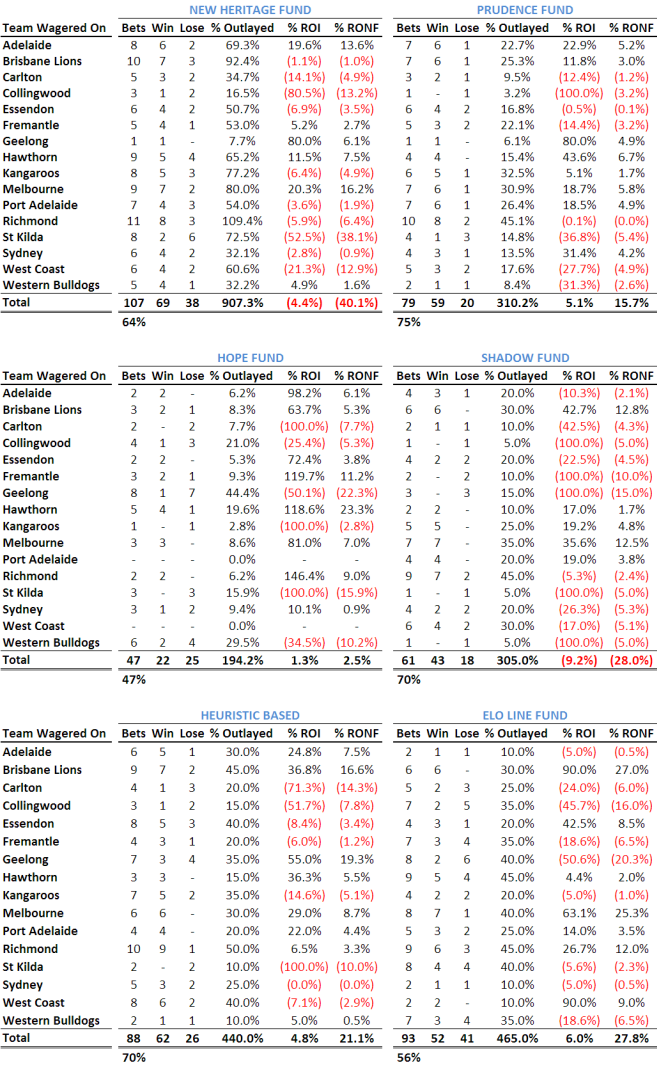
Alternatively, we could look at Fund performance by team wagered against.

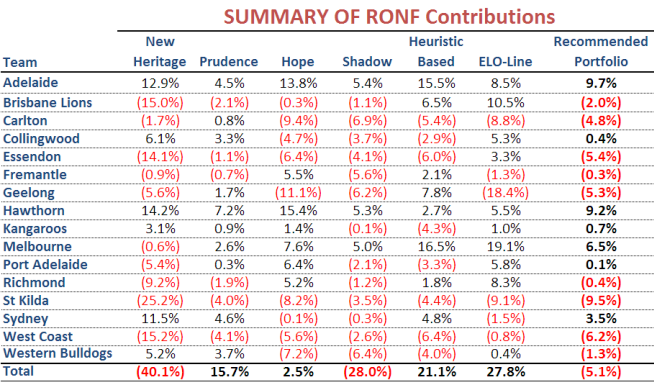
Averaging these two views gives us a way to estimate the contribution that each team has made to Fund (and Portfolio) performance across the season, whether we were hoping for the team to win or to lose.

New Heritage made money, in aggregate, on the games involving only six of the teams, losing money on the other 10. Games involving St Kilda caused the greatest losses, while games involving Hawthorn generated the greatest profit.

Prudence lost on 6 teams and won on 10, losing most heavily when West Coast was playing and winning most handsomely when Hawthorn were on the field. Hope also made most when Hawthorn were playing, but lost most heavily when the Cats took part.

Shadow lost most on Carlton and won most on Adelaide, while the Heuristic-Based Fund made most on Melbourne and lost most on West Coast. ELO-Line lost most on Geelong and won most on Melbourne.

In total, the Recommended Portfolio lost money on games involving any of 9 teams and won on games involving any of the other 7. St Kilda's contests were the most costly for this Portfolio, and Adelaide's were the most profitable.

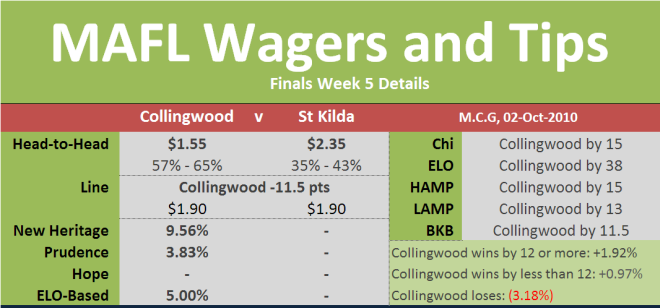
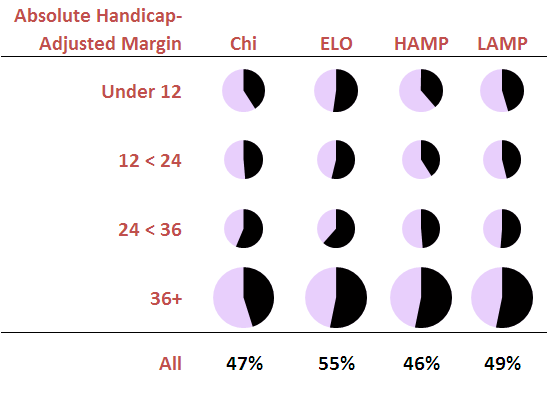
Next, we turn to Margin Tipper performance. BKB recorded the season's best Mean Average Prediction Error (MAPE), finishing on 29.57 points per game, ahead of LAMP on 29.98 and HAMP on 30.10. Best Median APE was turned in by LAMP with 26.0 followed by BKB and ELO on 26.5.

Across the season's entire 186 games, ELO correctly predicted 121.5 or 65.3% of them, BKB and LAMP managed 118.5 (63.7%), HAMP scored 117.5 (63.2%), and Chi lumbered to 111.5 (59.9%).

Well, that's it for another season. I think I've run more analyses, written more blogs, and learned more about the patterns in footy data and how to display them this season than in any of the previous five. And yet, we still made a loss, which is my lone regret.

I'll almost certainly be going around again in 2011, though there's much work to be done in the off-season with the entry of a 17th team next year and the introduction of the bye. Work is well-progressed on moving MAFL to a website format next year; more on this in future months.

(If you want a sneak peek, it's here [Actually - it's not any more ...]).

Any blogs I write during the off-season will be written on the new site. Hope to see you there.

Investors: please e-mail me with details of what you want done with your Funds.

MAFL 2010 : Round 27 (or GF 2.0)

Every so often things crop up that unexpectedly test the statistical models I've constructed. For example a client will ask for a model to be used for a practical purpose such as forecasting, or they'll ask me to rerun a set of scenarios that I've created using a model, but this time with slightly different inputs.

What makes these situations a test for the models - and, I'll be honest, frequently a 'hold-your-breath-as-you-run-the-numbers' moment for me - is when there's an obvious way to validate the results using pure commonsense. Forecasts should look like a plausible extention of the actual time series that you modelled, and scenario outputs based on different inputs should usually differ from the earlier outputs you produced in logical ways.

Last week's drawn Grand Final, which meant that the MAFL Models faced the unprecedented situation of having to forecast the result for exactly the same matchup two weeks running, provided just such a test.

I'm pleased and not just a little relieved to report that, to my mind, the MAFL models have 'passed' by behaving sensibly - although in the case of the New Heritage Fund, that's a relative rather than an absolute assessment.

Both the New Heritage Fund and Prudence Funds, chastened a tad and accordingly recalibrated by the Pies' inability to win last week, have stuck with the Pies, now priced at $1.55, but have made smaller wagers. As well, ELO, which is based on MARS Ratings, now forecasts a slightly smaller win for the Pies, but a win still large enough to encourage ELO-Line to wager its customary 5% on the Pies giving 11.5 start.

(I should note that a minor glitch had me reporting ELO as tipping the Pies to win by 51 points last week. It should have been by only 40 points. This week the forecast margin is 38 points.)

Chi, HAMP and LAMP have also made only small but nonetheless downward revisions to their predictions of the Pies' victory margin. Some validation for their 2-4 point adjustments is provided by the corresponding change in the bookie's margin - by 5 points, from 16.5 to 11.5 points.

Here's the detail:

In short, everything's pretty much as it was last weekend, though we stand to collect more this weekend if the Pies win than we would have had they won last weekend, and we also stand to lose less this weekend if they don't.

For the sake of completeness I should let you know that, this week, line bets are inclusive of extra time. So, in the unlikely event that the Pies and Saints again finish level at the end of normal time, our line bet will not be lost at that point. If the Pies then go on to kick two goals clear of the Saints by the time the hilarity finishes ensuing, we'd collect - on all the bets as it happens.

Based on the Margin Tippers margin predictions, HAMP will finish the season with a sub-30 MAPE provided the final margin lies between a Saints win by 6 and a Pies win by 36 points, and LAMP will do the same if the Saints win by 33 or fewer, or if the Pies win by 59 or fewer. BKB will finish with a MAPE below 29.5 if the Saints win by 19 or fewer, or if the Pies win by 42 or fewer.

Lastly, here's the week's full Ready Reckoner:

And that definitely is the last pre-round MAFL blog for 2010.


MAFL 2010 : Round 26 Results (of a fashion)

After that it all feels a little flat.

I just assumed there'd be extra time on Saturday and at least an attempt to find a winner on the day; making 44 players, 2 coaching staffs, 100,000 spectators and countless fans go through that all again seems cruel, unusual and frankly unnecessary.

Anyway, there it is - we've a Round 27 this year and another set of potential wagers, and I've a chance to see how many of my spreadsheets and programming scripts will break when faced with an unprecedented 27th round.

Whilst the teams walked away from the weekend no worse off than they entered it, the same can't be said for Investors. Our line bet on Collingwood giving 16.5 points start was, of course, a losing one, and our head-to-head wager paid off at only half price, which for us on the Pies at $1.45 was just 72.5c in the dollar. As a result, the Recommended Portfolio dropped 1.3% and MIN#017's dropped 2.9%. However - and I didn't expect this cliche to get another run - there's always next week.

Here's the Dashboard for Round 26:

Collingwood dropped a bit over 1 point on MARS Ratings as a result of the weekend's non-result, but still maintain a lead over the Cats of about that same margin. A loss next weekend, or even a win by just 1 or 2 points, would see them finish the season behind the Cats on MARS Ratings.

The Pies' MARS Ratings loss was the Saints' gain. Their 1 point increase served to increase their superiority over the Dogs, which now stands at 4 Ratings points. The Saints have no hope of overhauling the Cats though and grabbing 2nd spot unless they can contrive to produce a string of draws that imperils the venuing for the Boxing Day Test.

Each of the top 3 Margin Tippers based on Mean Absolute Prediction Error (MAPE) knocked 0.07 points from their respective MAPEs this week, leaving the ordering of BKB, LAMP then HAMP unchanged but dragging BKB under 29.5 points per game, LAMP now comfortably under 30, and HAMP within 0.04 points of 30.

ELO was the only Margin Tipper whose Median APE changed - up 0.5 points to 27, relegating it to joint third with HAMP, behind LAMP and BKB on 26 and 26.5 points respectively.

See you all again next week.


MAFL 2010 : Round 26 (Week 4 of the Finals a.k.a The GF)

There'll be no dramatic last game plunge into profitability for any Investor this season.

The best that Investors with the Recommended Portfolio can hope for is to end the season down by about 4.5%, and it'll take a Pies victory in the GF by 17 points or more to deliver them that result.

Once again this week it's New Heritage, Prudence and ELO-Line that are the active Funds. Hope has made no wagers, making this the third week in a row that it's been on a wager strike. New Heritage has lobbed 10.5% on the Pies at $1.45, while Prudence has placed 4.7% on the same team at the same price. ELO-Line's taken the Pies for 5% at $1.90 giving 16.5 start.

Including these wagers, every dollar in the New Heritage Fund has now been wagered almost 9 times during the season. For the other Funds, the equivalent 'turn' figures are: Prudence just over 3 times, Hope just under 2, Shadow just over 3, Heuristic-Based exactly 5, and ELO just over 4.5.

In aggregate, then, every dollar in the Recommended Portfolio has been put at risk almost 4.4 times during the season. Given TAB Sportsbet's typical vig of around 6.9% on head-to-head markets and 5.25% on line markets, the expected loss for the Recommended Portfolio for the season was therefore around 30%. So, the Recommended Portfolio will lose quite a bit less than it 'should' have - but you can't pay bills, I know, with unexpectedly small losses ...

Here's the detail on the week's bets and tips.

Not only do we have unanimity amongst tipsters in their prediction of the Pies to win on Saturday, but we also have near-uniformity in their opinions about the size of that victory. Three of them tip Collingwood by 17, and BKB tips them by a margin as close to 17 as you can get when you're forced to tip half-point margins. ELO's the outlier, predicting the Pies to win far more comfortably - by over 8 goals. All Margin Tippers therefore expect the Pies to cover the spread - albeit narrowly and, of course, excluding BKB.

Given those margin predictions, HAMP will finish the season with a sub-30 MAPE provided the Pies win by between 9 and 25 points, and LAMP will do the same if the Saints win by 16 or fewer, or if the Pies win by 50 or fewer. BKB will finish with a MAPE below 29.5 if the Saints win by 1 or fewer, or if the Pies win by 34 or fewer.

Here's the week's Ready Reckoner:

Saturday will be the first time in a decade that 1st has met 3rd in the Grand Final. The last time this occurred was back in 2000 when the minor premiers in the Dons toppled the Dees. It'll also be only the fourth time in 12 years that a team from 3rd has made the Grand Final.

Here's a summary of the last 11 seasons' Grand Finals in terms of the ladder positions in which the participating teams finished the home-and-away season.


MAFL 2010 : Round 25 Results (Week 3 of the Finals)

As predicted, the haloed and the winged triumphed over the furry this weekend, leaving us with a Pies v Saints Grand Final for only the second time in VFL/AFL history.

Presumably there are supernatural consequences of cursing saints, but it was difficult to avoid risking them on Saturday night if you were a MAFL Investor watching the game as the Saints went marching off and allowed the Dogs to tack on just enough late points to win on line betting by half a point.

That cost the Recommended Portfolio almost 1% and meant that it increased by only 2.2% over the two games. This leaves the Recommended Portfolio down by 6.4% on the season on the back of three straights weeks of profitability during the Finals.

MIN#017's Portfolio also climbed for the third successive week, this time by 9.1% to leave it down by 42.4% for the season. MIN#002's Portfolio remained unchanged at 72c.

Here's the Dashboard for Round 25:

On MARS Ratings, the two weekend winners both swapped places with the losers, which slips the Pies into 1st and the Cats into 2nd, and the Saints into 3rd and the Dogs into 4th.

Once again all tipsters picked both winners this weekend. Chi and ELO recorded the best Mean Absolute Prediction Errors (MAPEs) of 15 points per game, while HAMP managed 18, BKB 20, and LAMP 21.5. These high levels of accuracy produced reductions in the season-long MAPEs for all Margin Tippers but left their ordering unchanged.

BKB remains 1st on 29.56 points per game, ahead of LAMP on 29.98 - the first time it's been below 30 since Round 19 - and HAMP on 30.11.

Surprisingly, neither HAMP's not LAMP's excellent MAPEs would have translated into line betting success this season. HAMP's only been 46% accurate in selecting the correct line winner and LAMP's only been 49% accurate. In comparison, ELO's been right almost 55% of the time.

The Median APE metric has been no better at predicting line betting performance, since LAMP retains outright leadership on this measure with a score of 26 points. ELO knocked half a point from its Median APE this week to draw it level with BKB on 26.5 points and in joint 2nd place.

What's been the source of ELO's superior line betting accuracy in comparison to HAMP, LAMP and Chi (his accuracy is only 47%)? Being right more often in those games that were closer in terms of line betting it turns out, as the following graphic shows.

The rows in this graphic are based on the size of the absolute handicap-adjusted margin - the number that you get when you subtract the away team score from the home team score, add the home team handicap and then take the absolute value. For example, the absolute handicap-adjusted margin for a game that finishes 100-75 where the home team was giving 30.5 points start is 5.5 points, which is the absolute value of 100-75-30.5.

In line betting terms, therefore, the closest games are those on the first row of the table, and games become less close as we move down the rows.

Each pie reflects two things:

  • the proportion shaded black represents the accuracy of the particular Margin Tipper for games within the range of actual absolute handicap-adjusted margins described by the row
  • the size of the pies within each row is proportional to the number of games that have finished with that particular range of actual absolute handicap-adjusted margins

Now focus on ELO's column. You can see that it's done well relative to the other Margin Tippers in those games that finished with an absolute handicap-adjusted margin under 24 points - in fact, it's the only Margin Tipper with a better than 50% record for these games - and that it's been particularly accurate in those games that finished with an absolute handicap-adjusted margin of 24 to less than 36 points.

In those games that finished with an absolute handicap-adjusted margin of 36 points or more, which have been the most frequent type of games this season, it hasn't been especially accurate, but no less so that the other Margin Tippers.

This week, in terms of home-and-away ladder positions, we saw 1st defeat 2nd and 3rd defeat 4th. Historically, teams from 1st and 2nd have now performed equally well in the 3rd week of the Finals, appearing 11 times each for 8 wins and 3 losses.

Teams from 3rd, however, have a much better record than teams from 4th, though they've appeared in the Semis on two fewer occasions. Third-placed teams now have a 44% record of proceeding to the Grand Final, while fourth-placed teams have only an 18% record.