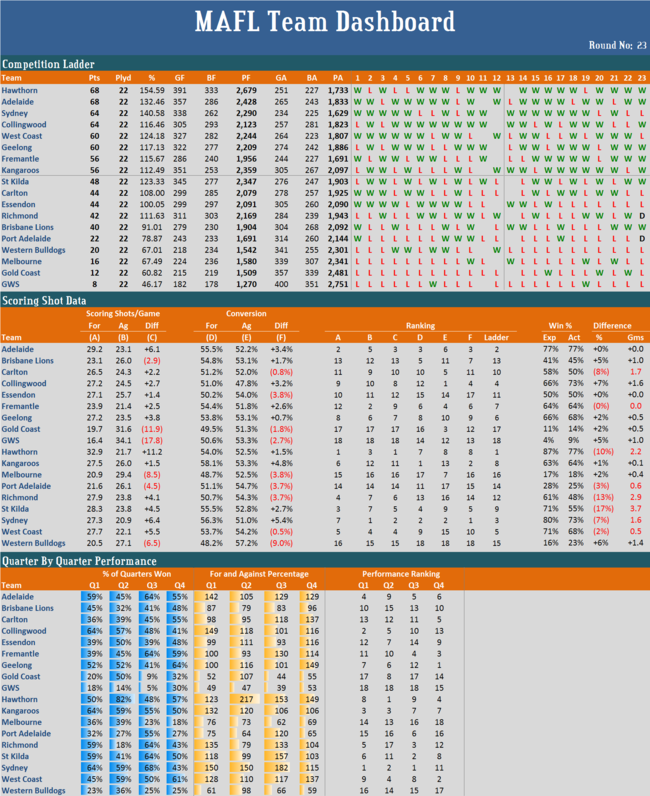
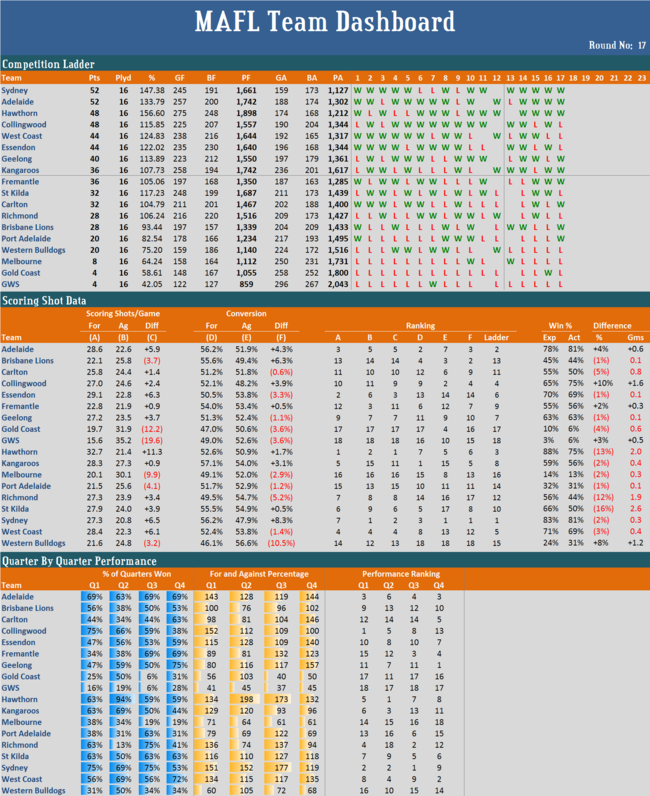
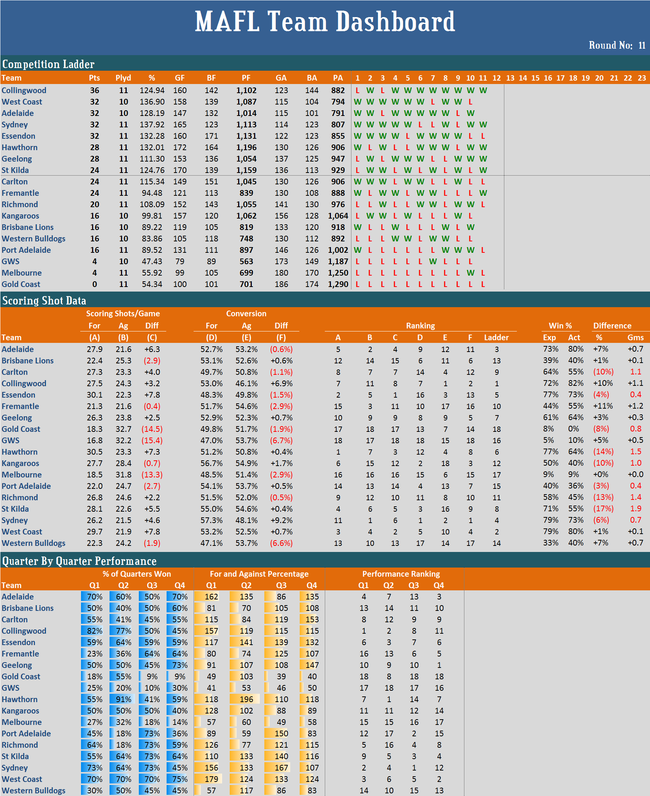
MAFL 2012 : Team Dashboard for Round 23 (Final)
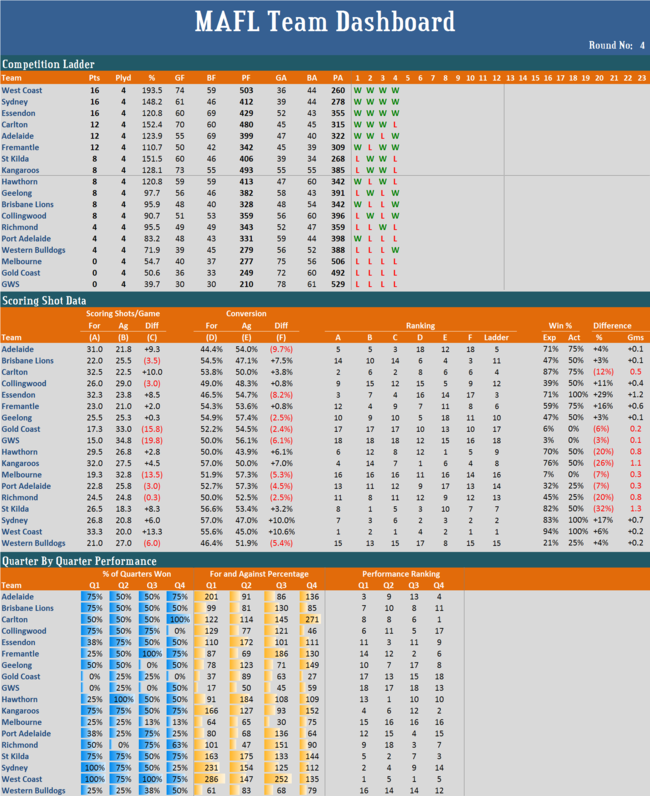
The final Team Dashboard for 2012 is below.Ladder position aside, some of the good and bad points for each team are: 

  • Adelaide: 2nd on own scoring shot creation but 9th in Q2s
  • Brisbane Lions: 5th on own scoring shot conversion but 15th in Q2s 
  • Carlton: 5th on opponent scoring shot conversion but 13 in Q1s
  • Collingwood: 1st on opponent scoring shot conversion but 10th on opponent scoring shot creation and 13th in Q4s
  • Essendon: 7th on Q2s but 15th on own scoring shot conversion
  • Fremantle: 2nd on opponent scoring shot creation but 12th on own scoring shot creation
  • Geelong: 1st on Q4s but 12th on Q3s
  • Gold Coast: 3rd on opponent scoring shot conversion (and 17th on a number of measures)
  • GWS: 12th on opponent scoring shot conversion (and 18th on a number of measures)
  • Hawthorn: (1st on a number of measures) but 9th in Q3s
  • Kangaroos: 1st on own scoring shot conversion but 13th on opponent scoring shot conversion
  • Melbourne: 7th on opponent scoring shot conversion but 18th in Q4s
  • Port Adelaide: 6th in Q3s but 17th on opponent scoring shot conversion
  • Richmond: 3rd in Q3s and 4th on own scoring shot creation, but 17th in Q2s
  • St Kilda: 2nd in Q3s and 3rd on own scoring shot creation, but 11th in Q1s
  • Sydney: 1st in Q1s and Q3s, but 7th on own scoring shot creation and 11th in Q4s
  • West Coast: 2nd in Q4s but 15th on opponent scoring shot conversion
  • Western Bulldogs: 14th in Q2s (if we're forced to list something), but 18th on own and opponent scoring shot conversion 


MAFL 2012 : Team Dashboard for Round 19

The latest Team Dashboard follows.

This week I draw your attention to each team's recent winning and losing streaks:

  • Sydney's now won 9 in a row
  • Adelaide's won 7 of its last 9 games
  • Collingwood's won 13 of its last 15 games
  • Hawthorn, before losing this week, had won 9 in a row
  • West Coast has won only 3 of its last 7 games
  • Geelong has won 5 of its last 7 games
  • The Roos have won 7 of their last 8 games
  • Essendon's won only 1 of its last 5 games
  • Fremantle's won 5 in a row
  • St Kilda's won 3 of its last 5
  • Carlton's won 3 of its last 6
  • Richmond's won just 2 of its last 6
  • Brisbane's won only 1 of its last 5
  • Port Adelaide's won just 1 of its last 8
  • The Dogs have now lost 7 in a row
  • Melbourne's won only 2 of its last 7
  • GWS' win snapped a 10-game losing streak
  • The Gold Coast has lost its last 3 games and has won only a single game this season


MAFL 2012 : Team Dashboard for Round 16

The latest Team Dashboard follows.

This week, let's identify for each team the MAFL Dashboard statistics that are most at odds with the team's ladder position:

  • Adelaide - 2nd on the ladder but no higher than 3rd on any on the MAFL Dashboard metrics
  • Brisbane Lions - 13th on the ladder but 4th on Scoring Shot Conversion and 5th on Opponent Scoring Shot Conversion (but 12th and 13th on Own and Opponent Scoring Shot Production)
  • Carlton - 12th on the ladder but 8th in final terms with a 60% winning rate and a 140 Percentage
  • Collingwood - 3rd on the ladder but 1st on Opponent Scoring Shot Conversion, and 1st in 1st Quarters with an 80% winning rate and a 167 Percentage
  • Essendon - 6th on the ladder but 12th on Own and on Opponent Scoring Shot Conversion, and 2nd on Own Scoring Shot Production
  • Fremantle - 10th on the ladder but 5th on Opponent Scoring Shot Production, 4th in 3rd quarters, and 5th in final terms
  • Geelong - 7th on the ladder but 12th in 1st and 3rd terms (with a sub-50% winning rate in each) and 2nd in final terms (with a 73% winning rate and a 153 Percentage)
  • Gold Coast - 17th on the ladder but 3rd in Opponent Scoring Shot Conversion
  • GWS - 18th on the ladder but 13th in Opponent Scoring Shot Conversion
  • Hawthorn - 4th on the ladder but 1st on Own Scoring Shot Production and 10th on Own Scoring Shot Conversion, as well as 1st on 2nd quarters and 9th on 3rd quarters
  • Kangaroos - 9th on the ladder but 1st on Own Scoring Shot Conversion and 15th on Opponent Scoring Shot Conversion
  • Melbourne - 16th on the ladder but 8th on Opponent Scoring Shot Conversion and 18th on final terms with a 20% winning rate and a 62 Percentage
  • Port Adelaide - 15th on the ladder but 9th on Own Scoring Shot Conversion and 7th on 3rd quarters with a 60% winning rate and a 122 Percentage
  • Richmond - 11th on the ladder, 7th on both Own and Opponent Scoring Shot Production, but 14th and 16th on Own and Opponent Scoring Shot Conversion. Also, 3rd on 1st terms and 2nd on 3rd terms, but 18th on 2nd terms
  • St Kilda - 8th on the ladder but 3rd on Own Scoring Shot Conversion and 17th on Opponent Scoring Shot Conversion. Also, 3rd in 3rd terms and 4th in final terms, winning two-thirds of each
  • Sydney - 1st on the ladder but 8th on Own Scoring Shot Production and 10th in final terms with only a 50% winning rate
  • West Coast - 5th on the ladder but 10th on Opponent Scoring Shot Conversion, 8th in 3rd terms, and 1st in final terms with a 77% winning rate and a 143 Percentage
  • Western Bulldogs - 14th on the ladder but 18th on Own and on Opponent Scoring Shot Conversion, as well as 17th on 1st terms with a 27% winning rate and a 57 Percentage. 

MAFL 2012 : Team Dashboard for Round 15

The latest Team Dashboard follows.

Based purely on Scoring Shots statistics and the Win Production Function I derived last year, five teams have won one or more games fewer than their statistics would suggest they "should" have, and three teams have won one or more games "extra".

Specifically, 

  • St Kilda has won 2.7 games fewer, Hawthorn 2.1, Carlton 1.2, Gold Coast 1.1, and Richmond 1.0 games fewer
  • Collingwood has won 1.4 games more, the Dogs 1.3, and Adelaide 1.1 games more

A competition ladder based on the expected wins from the Win Production Function would have the same teams in the top 8 as we have now in the competition proper, though ordered as follows (teams' actual ladder positions are in brackets after their name): Hawthorn (5th), Sydney (1st), West Coast (2nd), Essendon (6th), Adelaide (3rd), St Kilda (8th), Collingwood (4th), Geelong (7th).

MAFL 2012 : Team Dashboard for Round 14

The latest Team Dashboard is below.

This week I've calculated the Spearman Rank Correlations between team competition ladder positions and their rankings on the various measures in the middle and lower sections of the Dashboard. The results are, in order, from highest to lowest correlation: 

  • Correlation between Ladder Position and Scoring Shots Per Game Differential (ie column C in the Scoring Shot Data section) : +0.89
  • Correlation between Ladder Position and Q1 Performances (ie column Q1 in the Quarter-by-Quarter Performance section) : +0.85
  • Correlation between Ladder Position and Q2 Performances (ie column Q2) : +0.82
  • Correlation between Ladder Position and Scoring Shots Per Game For (ie column A) : +0.82
  • Correlation between Ladder Position and Scoring Shots Per Game Against (ie column B) : +0.78
  • Correlation between Ladder Position and Conversion Rate Differential (ie column F) : +0.61
  • Correlation between Ladder Position and Q4 Performances (ie column Q4) : +0.59
  • Correlation between Ladder Position and Q3 Performances (ie column Q3) : +0.46
  • Correlation between Ladder Position and Conversion Rate For (ie column D) : +0.46
  • Correlation between Ladder Position and Conversion Rate Against (ie column E) : +0.39

One way of summarising these results would be to say that success this season has so far been about first half performances and about generating more scoring shots for your own team than you allow your opponents to generate. In driving up that scoring shot differential, success has been marginally more associated with generating more shots oneself than with denying opponents their scoring shots.


MAFL 2012 : Team Dashboard for Round 13

Right now, the teams that rank 1st to 4th in terms of points conceded per game also fill the first four places on the competition ladder, while those that rank 1st to 4th in terms of points scored per game currently lie 6th, 8th, 11th and 4th respectively. It seems then as though success in the competition is more related to defence than it is to offence.

Sydney, Essendon and West Coast's defensive superiority has come from denying opposing teams' opportunities to score: they have the three best records in terms of scoring shots conceded per game of all teams in the competition.

Collingwood, however, has not denied teams scoring shots - it has only the 12th best performance in the league on this measure - but has presented them with opportunities that have been relatively hard to convert. Collingwood's opponents have converted only 46.7% of their scoring opportunities, a rate fully 2 percentage points lower than for any other team in the competition.

Fremantle and St Kilda are two other teams that - like Sydney, Essendon and West Coast - have been relatively good at denying their opponents scoring opportunities. That's why they occupy positions 4 and 6 in terms of scoring shots conceded per game. What's hurt them though is that their opponents have been able or allowed to convert those opportunities at relatively high rates: about 55% of the scoring opportunities they've presented to opponents have been converted into goals. 

MAFL 2012 : Team Dashboard for Round 12

The latest Team Dashboard follows.

This week I'll draw your attention to the columns at the right of the Scoring Shot Data section where I use the Win Production Function that I created last year, which allows me to estimate what a team's winning percentage in a season should be based solely on its offensive and defensive goal and behind scoring statistics during that season.

If we compare the ranking that we obtain from each team's expected winning percentage with current ladder positions we find a difference of two places or more for ten teams:

  • Adelaide and Fremantle are 4 places higher on the competition ladder than their scoring statistics suggest
  • Collingwood, Geelong and West Coast are 2 places higher
  • Hawthorn is 5 places lower (they've won only two-thirds of their games but their scoring statistics suggest they should have an 80% winning rate)
  • Carlton, Gold Coast, St Kilda and Sydney are 2 places lower

MAFL 2012 : Team Dashboard for Round 10

The latest Team Dashboard follows.

Looking only at teams' Quarter-by-Quarter performances, one way of classifying them is as follows:

Teams with one relative standout quarter

  • Adelaide (weakest in 3rd terms)
  • Lions (strongest in 4th terms)
  • Gold Coast (strongest in 2nd terms)
  • Richmond (weakest in 2nd terms)
  • St Kilda (strongest in 3rd terms)
  • Sydney (weakest in 4th terms)
  • Western Bulldogs (strongest in 2nd terms)

Teams with two relative standout quarters

  • Carlton (strongest in 4th terms, weakest in 2nd)
  • Essendon (strongest in 2nd terms, weakest in 4th)
  • Geelong (strongest in 2nd terms, weakest in 3rd)
  • Hawthorn (strongest in 2nd terms, weakest in 3rd)
  • Kangaroos (strongest in 2nd terms, weakest in 4th)

Teams with three relative standout quarters

  • Collingwood (strongest in 1st and 2nd terms, weakest in 4th)
  • Fremantle (strongest in 3rd terms, weakest in 1st and 2nd)
  • Port Adelaide (strongest in 3rd terms, weakest in 2nd and 4th)

Teams weak in every quarter

  • GWS and Melbourne

Teams strong in every quarter

  • West Coast


MAFL 2012 : Team Dashboard for Round 8

The latest Team Dashboard follows in which you can find out that: 

  • Adelaide has the 2nd best record of all teams in Quarters 1 and 4, but is 13th in Quarter 3s.
  • Brisbane, in aggregate, has outscored its opponents in only Quarter 3s.
  • Carlton ranks 4th and 5th in Quarters 1 and 4, but ranks only 11th in Quarters 2 and 3.
  • Collingwood's quarter-by-quarter record declines as the game progresses. It's 3rd based on Quarter 1 performances, 5th based on Quarter 2, 9th based on Quarter 3, and 15th on Quarter 4.
  • Essendon is ranked 2nd on Quarter 2 performances.
  • Fremantle is ranked last on Quarter 1 performances and just 14th on Quarter 2 performances, but improves in the 2nd half to be ranked 2nd in Quarter 3s and 3rd in Quarter 4s.
  • Geelong is ranked 6th on Quarter 4 performances.
  • Gold Coast is ranked 7th on Quarter 2 performances.
  • GWS, in aggregate, has been outscored by almost 2:1 in every quarter, almost 3:1 in 1st terms.
  • Hawthorn is ranked 14th on Quarter 3 performances and 1st on Quarter 2s.
  • Kangaroos, in aggregate, have outscored their opponents in every quarter.
  • Melbourne have yet to win a final term, having drawn only one of eight.
  • Port Adelaide are ranked 3rd on Quarter 3 performances.
  • Richmond are ranked 10th on Quarter 1 performances and 17th on Quarter 2s, but 5th on Quarter 3s and 4th on Quarter 4s.
  • Sydney are ranked 1st on Quarter 3 performances but only 13th on final terms.
  • West Coast are ranked only 7th on Quarter 3 performances.
  • Western Bulldogs, in aggregate, have outscored their opponents in only Quarter 2s. 

MAFL 2012 : Team Dashboard for Round 6

The latest Team Dashboard is below.

I know we have some new visitors to MAFL this year, so I thought I should provide an explanation of the rightmost columns of the Scoring Shot Data section. These columns are based on some analysis I undertook to create a "win production function" for AFL, which is an equation that relates a team's scoring shot data to the number of games we'd expect they'd have won given that data. You can think of it as a way of measuring how well or how poorly a team has been "rewarded" for its scoring performance.

As it stands now, 3 teams (the Roos, Tigers and Saints) have won at least one game fewer than we'd expect given their current scoring statistics, and 1 team (Collingwood) has won one game more than we'd expect. Three other teams - Adelaide, Fremantle and West Coast - have also won more games than their statistics would suggest, though the benefit is not yet equal to a full game.

Similarly, the Gold Coast, Hawthorn, Melbourne and Port Adelaide have won fewer games than their statistics would entitle them to, though the difference is also not yet equal to a full game.

MAFL 2012 : Team Dashboard for Round 5

The latest Team Dashboard follows. Here's a factoid for each team:

  • Adelaide : 3rd highest scoring shots created per game and 5th lowest scoring shots allowed, but last in terms of both own and opponents' conversion of those scoring shots
  • Brisbane Lions : Sub 100 percentage for every quarter except the 3rd
  • Carlton : lowest Opponent conversion rate in the league
  • Collingwood : still yet to win a final term
  • Essendon : percentage over 100 in every quarter
  • Fremantle : 14th in 1st and 2nd quarters, 4th in 3rd and 4th quarters
  • Geelong : 3rd best conversion rate in the league
  • Gold Coast : yet to win a 1st quarter
  • GWS : yet to win a 3rd quarter
  • Hawthorn : yet to lose a 2nd quarter
  • Kangaroos : 1st in scoring shot production across the league
  • Melbourne : 2nd lowest scoring shot production and 3rd highest scoring shots conceded
  • Port Adelaide : 3rd best in 3rd quarters
  • Richmond : yet to win a 2nd term
  • St Kilda : lowest scoring shots conceded per game
  • Sydney : highest scoring shot conversion rate and greatest own vs opponent scoring shot conversion rate differential
  • West Coast : best 1st and 3rd quarter records in the league (and 2nd best 2nd quarter performance)
  • Western Bulldogs : 3rd worst 1st quarter performance in the league


MAFL 2012 : Team Dashboard for Round 4

It's still a little early to be discerning and commenting on any significant team differences, so I'll again content myself with a few parenthetic observations on this week's Team Dashboard: 

  • West Coast are the first team to have scored more than 500 points for the season
  • Melbourne and GWS are the first teams to have conceded 500 points
  • St Kilda's scoring statistics so far this season are, according to the Win Production Function, good enough to have earned them 1.3 wins more than they've achieved
  • The Roos' scoring statistics are good enough to have earned them an extra 1.1 wins
  • Collingwood have not won a final term so far this season
  • Geelong have not won a 3rd term