MAFL 2012 : Team Dashboard for Round 12
/The latest Team Dashboard follows.
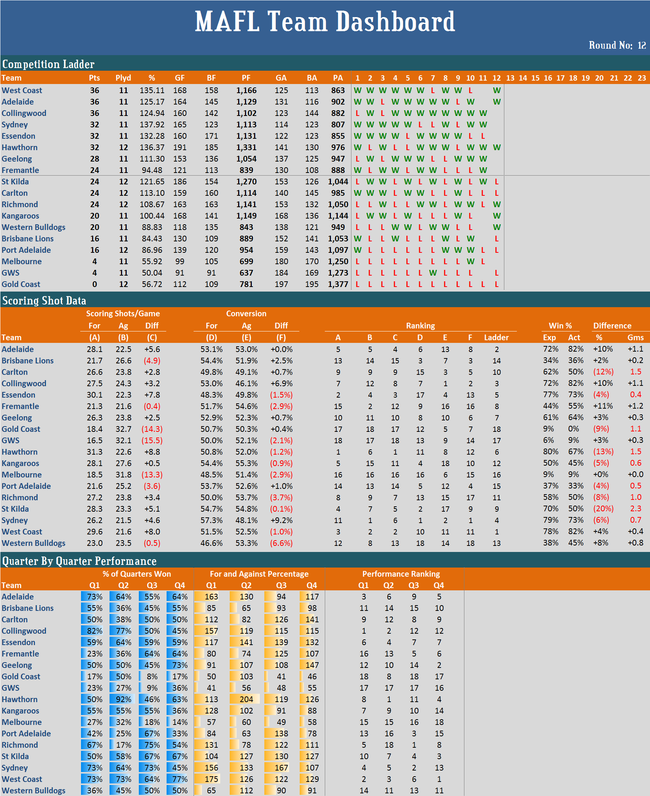
This week I'll draw your attention to the columns at the right of the Scoring Shot Data section where I use the Win Production Function that I created last year, which allows me to estimate what a team's winning percentage in a season should be based solely on its offensive and defensive goal and behind scoring statistics during that season.
If we compare the ranking that we obtain from each team's expected winning percentage with current ladder positions we find a difference of two places or more for ten teams:
- Adelaide and Fremantle are 4 places higher on the competition ladder than their scoring statistics suggest
- Collingwood, Geelong and West Coast are 2 places higher
- Hawthorn is 5 places lower (they've won only two-thirds of their games but their scoring statistics suggest they should have an 80% winning rate)
- Carlton, Gold Coast, St Kilda and Sydney are 2 places lower