MAFL 2012 : Team Dashboard for Round 6
/The latest Team Dashboard is below.
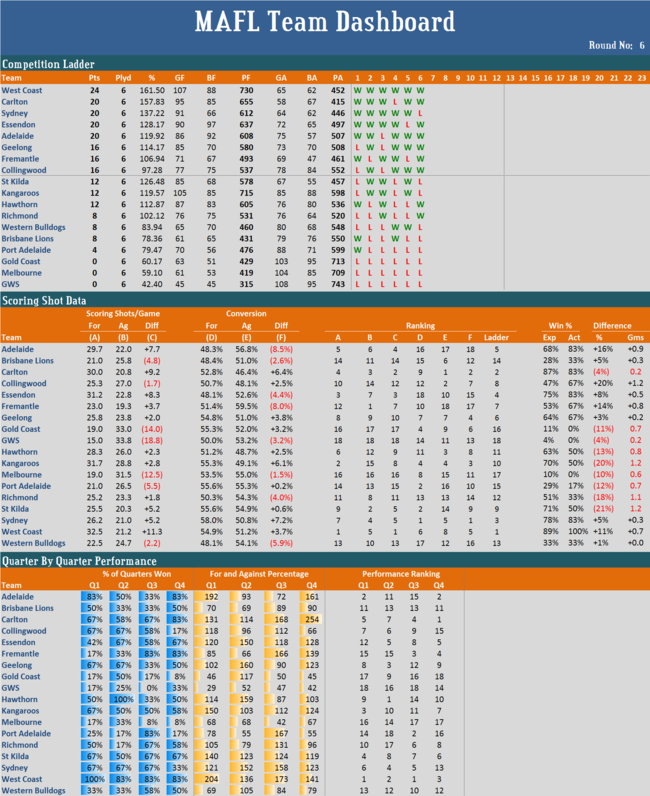
I know we have some new visitors to MAFL this year, so I thought I should provide an explanation of the rightmost columns of the Scoring Shot Data section. These columns are based on some analysis I undertook to create a "win production function" for AFL, which is an equation that relates a team's scoring shot data to the number of games we'd expect they'd have won given that data. You can think of it as a way of measuring how well or how poorly a team has been "rewarded" for its scoring performance.
As it stands now, 3 teams (the Roos, Tigers and Saints) have won at least one game fewer than we'd expect given their current scoring statistics, and 1 team (Collingwood) has won one game more than we'd expect. Three other teams - Adelaide, Fremantle and West Coast - have also won more games than their statistics would suggest, though the benefit is not yet equal to a full game.
Similarly, the Gold Coast, Hawthorn, Melbourne and Port Adelaide have won fewer games than their statistics would entitle them to, though the difference is also not yet equal to a full game.