MAFL 2012 : Team Dashboard for Round 14
/The latest Team Dashboard is below.
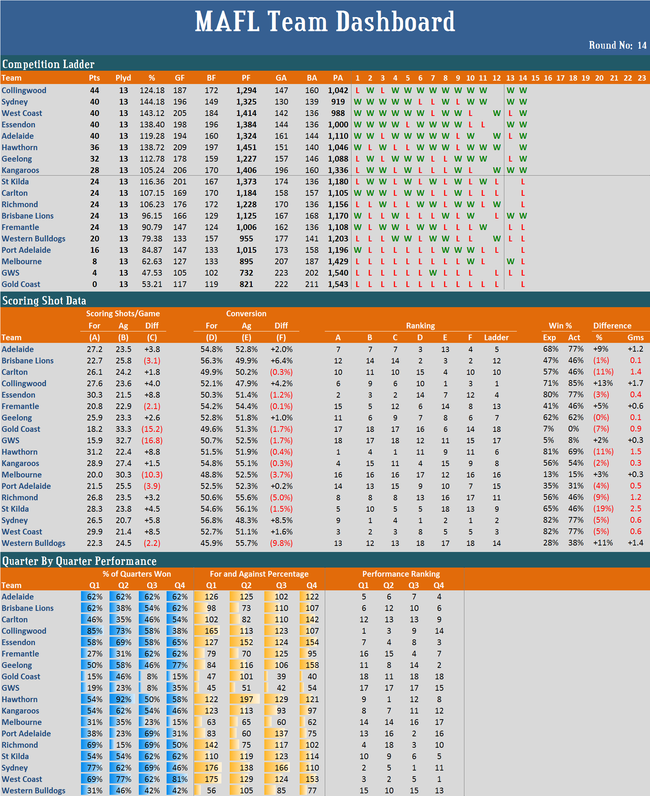
This week I've calculated the Spearman Rank Correlations between team competition ladder positions and their rankings on the various measures in the middle and lower sections of the Dashboard. The results are, in order, from highest to lowest correlation:
- Correlation between Ladder Position and Scoring Shots Per Game Differential (ie column C in the Scoring Shot Data section) : +0.89
- Correlation between Ladder Position and Q1 Performances (ie column Q1 in the Quarter-by-Quarter Performance section) : +0.85
- Correlation between Ladder Position and Q2 Performances (ie column Q2) : +0.82
- Correlation between Ladder Position and Scoring Shots Per Game For (ie column A) : +0.82
- Correlation between Ladder Position and Scoring Shots Per Game Against (ie column B) : +0.78
- Correlation between Ladder Position and Conversion Rate Differential (ie column F) : +0.61
- Correlation between Ladder Position and Q4 Performances (ie column Q4) : +0.59
- Correlation between Ladder Position and Q3 Performances (ie column Q3) : +0.46
- Correlation between Ladder Position and Conversion Rate For (ie column D) : +0.46
- Correlation between Ladder Position and Conversion Rate Against (ie column E) : +0.39
One way of summarising these results would be to say that success this season has so far been about first half performances and about generating more scoring shots for your own team than you allow your opponents to generate. In driving up that scoring shot differential, success has been marginally more associated with generating more shots oneself than with denying opponents their scoring shots.