Home Team Wagering: Rumours of Its Death Have Been Greatly Exaggerated

I should probably have noticed this sooner, but last year was quite a profitable year for blindly wagering on Home Teams. A gambler who level-staked the AFL Designated Home Team in every game in the head-to-head and in the line market would have recorded an 8.4% ROI on his or her head-to-head wagers and a 4.1% ROI on his or her line wagers.
Read More

Grand Final Margins Through History and a Last Look at the 2010 Home-and-Away Season

A couple of final charts before GF 2.0.

The first chart looks at the history of Grand Finals, again. Each point in the chart reflects four things about the Grand Final to which it pertains ...
Read More

Grand Final History: A Look at Ladder Positions

Across the 111 Grand Finals in VFL/AFL history - excluding the two replays - only 18 of them, or about 1-in-6, has seen the team finishing 1st on the home-and-away ladder play the team finishing 3rd.

This year, of course, will be the nineteenth.

Far more common, as you'd expect, has been a matchup between the teams from 1st and 2nd on the ladder. This pairing accounts for 56 Grand Finals, which is a smidgeon over half, and has been so frequent partly because of the benefits accorded to teams finishing in these positions by the various finals systems that have been in use, and partly no doubt because these two teams have tended to be the best two teams.

2010 - Grand Final Results by Ladder Position.png

In the 18 Grand Finals to date that have involved the teams from 1st and 3rd, the minor premier has an 11-7 record, which represents a 61% success rate. This is only slightly better than the minor premiers' record against teams coming 2nd, which is 33-23 or about 59%.

Overall, the minor premiers have missed only 13 of the Grand Finals and have won 62% of those they've been in.

By comparison, teams finishing 2nd have appeared in 68 Grand Finals (61%) and won 44% of them. In only 12 of those 68 appearances have they faced a team from lower on the ladder; their record for these games is 7-5, or 58%.

Teams from 3rd and 4th positions have each made about the same number of appearances, winning a spot about 1 year in 4. Whilst their rates of appearance are very similar, their success rates are vastly different, with teams from 3rd winning 46% of the Grand Finals they've made, and those from 4th winning only 27% of them.

That means that teams from 3rd have a better record than teams from 2nd, largely because teams from 3rd have faced teams other than the minor premier in 25% of their Grand Final appearances whereas teams from 2nd have found themselves in this situation for only 18% of their Grand Final appearances.

Ladder positions 5 and 6 have provided only 6 Grand Finalists between them, and only 2 Flags. Surprisingly, both wins have been against minor premiers - in 1998, when 5th-placed Adelaide beat North Melbourne, and in 1900 when 6th-placed Melbourne defeated Fitzroy. (Note that the finals systems have, especially in the early days of footy, been fairly complex, so not all 6ths are created equal.)

One conclusion I'd draw from the table above is that ladder position is important, but only mildly so, in predicting the winner of the Grand Final. For example, only 69 of the 111 Grand Finals, or about 62%, have been won by the team finishing higher on the ladder.

It turns out that ladder position - or, more correctly, the difference in ladder position between the two grand finalists - is also a very poor predictor of the margin in the Grand Final.

2010 - Grand Final Results by Ladder Position - Chart.png

This chart shows that there is a slight increase in the difference between the expected number of points that the higher-placed team will score relative to the lower-placed team as the gap in their respective ladder positions increases, but it's only half a goal per ladder position.

What's more, this difference explains only about half of one percentage of the variability in that margin.

Perhaps, I thought, more recent history would show a stronger link between ladder position difference and margin.

2010 - Grand Final Results by Ladder Position - Chart 2.png

Quite the contrary, it transpires. Looking just at the last 20 years, an increase in the difference of 1 ladder position has been worth only 1.7 points in increased expected margin.

Come the Grand Final, it seems, some of your pedigree follows you onto the park, but much of it wanders off for a good bark and a long lie down.

Visualising AFL Grand Final History

I'm getting in early with the Grand Final postings.

The diagram below summarises the results of all 111 Grand Finals in history, excluding the drawn Grand Finals of 1948 and 1977, and encodes information in the following ways:

  • Each circle represents a team. Teams can appear once or twice (or not at all) - as a red circle as Grand Final losers and as a green circle as Grand Final winners.
  • Circle size if proportional to frequency. So, for example, a big red circle, such as Collingwood's denotes a team that has lost a lot of Grand Finals.
  • Arrows join Grand Finalists and emanate from the winning team and terminate at the losing team. The wider the arrow, the more common the result.

No information is encoded in the fact that some lines are solid and some are dashed. I've just done that in an attempt to improve legibility. (You can get a PDF of this diagram here, which should be a little easier to read.)

2010 - Grand Final Results 1.png

I've chosen not to amalgamate the records of Fitzroy and the Lions, Sydney and South Melbourne, or Footscray and the Dogs (though this last decision, I'll admit, is harder to detect). I have though amalgamated the records of North Melbourne and the Roos since, to my mind, the difference there is one of name only.

The diagram rewards scrutiny. I'll just leave you with a few things that stood out for me:

  • Seventeen different teams have been Grand Final winners; sixteen have been Grand Final losers
  • Wins have been slightly more equitably shared around than losses: eight teams have pea-sized or larger green circles (Carlton, Collingwood, Essendon, Hawthorn, Melbourne, Richmond, Geelong and Fitzroy), six have red circles of similar magnitude (Collingwood, South Melbourne, Richmond, Carlton, Geelong and Essendon).
  • I recognise that my vegetable-based metric is inherently imprecise and dependent on where you buy your produce and whether it's fresh or frozen, but I feel that my point still stands.
  • You can almost feel the pain radiating from those red circles for the Pies, Dons and Blues. Pies fans don't even have the salve of a green circle of anything approaching compensatory magnitude.
  • Many results are once-only results, with the notable exceptions being Richmond's dominance over the Blues, the Pies' over Richmond, and the Blues over the Pies (who knew - football Grand Final results are intransitive?), as well as Melbourne's over the Dons and the Pies.

As I write this, the Saints v Dogs game has yet to be played, so we don't know who'll face Collingwood in the Grand Final.

If it turns out to be a Pies v Dogs Grand Final then we'll have nothing to go on, since these two teams have not previously met in a Grand Final, not even if we allow Footscray to stand-in for the Dogs.

A Pies v Saints Grand Final is only slightly less unprecedented. They've met once before in a Grand Final when the Saints were victorious by one point in 1966.

A Proposition Bet on the Game Margin

We've not had a proposition bet for a while, so here's the bet and a spiel to go with it:

"If the margin at quarter time is a multiple of 6 points I'll pay you $5; if it's not, you pay me a $1. If the two teams are level at quarter-time it's a wash and neither of us pay the other anything.

Now quarter-time margins are unpredictable, so the probability of the margin being a multiple of 6 is 1-in-6, so my offering you odds of 5/1 makes it a fair bet, right? Actually, since goals are worth six points, you've probably got the better of the deal, since you'll collect if both teams kick the same number of behinds in the quarter.

Deal?"

At first glance this bet might look reasonable, but it isn't. I'll take you through the mechanics of why, and suggest a few even more lucrative variations.

Firstly, taking out the drawn quarter scenario is important. Since zero is divisible by 6 - actually, it's divisible by everything but itself - this result would otherwise be a loser for the bet proposer. Historically, about 2.4% of games have been locked up at the end of the 1st quarter, so you want those games off the table.

You could take the high moral ground on removing the zero case too, because your probability argument implicitly assumes that you're ignoring zeroes. If you're claiming that the chances of a randomly selected number being divisible by 6 is 1-in-6 then it's as if you're saying something like the following:

"Consider all the possible margins of 12 goals or less at quarter time. Now twelve of those margins - 6, 12, 18, 24, 30, 36, 42, 48, 54, 60, 66 and 72 - are divisible by 6, and the other 60, excluding 0, are not. So the chances of the margin being divisible by 6 are 12-in-72 or 1-in-6."

In running that line, though, I'm making two more implicit assumptions, one fairly obvious and the other more subtle.

The obvious assumption I'm making is that every margin is equally likely. Demonstrably, it's not. Smaller margins are almost universally more frequent than larger margins. Because of this, the proportion of games with margins of 1 to 5 points is more than 5 times larger than the proportion of games with margins of exactly 6 points, the proportion of games with margins of 7 to 11 points is more than 5 times larger than the proportion of games with margins of exactly 12 points, and so on. It's this factor that, primarily, makes the bet profitable.

The tendency for higher margins to be less frequent is strong, but it's not inviolate. For example, historically more games have had a 5-point margin at quarter time than a 4-point margin, and more have had an 11-point margin than a 10-point margin. Nonetheless, overall, the declining tendency has been strong enough for the proposition bet to be profitable as I've described it.

Here is a chart of the frequency distribution of margins at the end of the 1st quarter.

The far-less obvious assumption in my earlier explanation of the fairness of the bet is that the bet proposer will have exactly five-sixths of the margins in his or her favour; he or she will almost certainly have more than this, albeit only slightly more.

This is because there'll be a highest margin and that highest margin is more likely not to be divisible by 6 than it is to be divisible by 6. The simple reason for this is, as we've already noted, that only one-sixth of all numbers are divisible by six.

So if, for example, the highest margin witnessed at quarter-time is 71 points (which, actually, it is), then the bet proposer has 60 margins in his or her favour and the bet acceptor has only 11. That's 5 more margins in the proposer's favour than the 5/1 odds require, even if every margin was equally likely.

The only way for the ratio of margins in favour of the proposer to those in favour of the acceptor to be exactly 5-to-1 would be for the highest margin to be an exact multiple of 6. In all other cases, the bet proposer has an additional edge (though to be fair it's a very, very small one - about 0.02%).

So why did I choose to settle the bet at the end of the 1st quarter and not instead, say, at the end of the game?

Well, as a game progresses the average margin tends to increase and that reduces the steepness of the decline in frequency with increasing margin size.

Here's the frequency distribution of margins as at game's end.

(As well as the shallower decline in frequencies, note how much less prominent the 1-point game is in this chart compared to the previous one. Games that are 1-point affairs are good for the bet proposer.)

The slower rate of decline when using 4th-quarter rather than 1st-quarter margins makes the wager more susceptible to transient stochastic fluctuations - or what most normal people would call 'bad luck' - so much so that the wager would have been unprofitable in just over 30% of the 114 seasons from 1897 to 2010, including a horror run of 8 losing seasons in 13 starting in 1956 and ending in 1968.

Across all 114 seasons taken as a whole though it would also have been profitable. If you take my proposition bet as originally stated and assume that you'd found a well-funded, if a little slow and by now aged, footballing friend who'd taken this bet since the first game in the first round of 1897, you'd have made about 12c per game from him or her on average. You'd have paid out the $5 about 14.7% of the time and collected the $1 the other 85.3% of the time.

Alternatively, if you'd made the same wager but on the basis of the final margin, and not the margin at quarter-time, then you'd have made only 7.7c per game, having paid out 15.4% of the time and collected the other 84.6% of the time.

One way that you could increase your rate of return, whether you choose the 1st- or 4th-quarter margin as the basis for determining the winner, would be to choose a divisor higher than 6. So, for example, you could offer to pay $9 if the margin at quarter-time was divisible by 10 and collect $1 if it wasn't. By choosing a higher divisor you virtually ensure that there'll be sufficient decline in the frequencies that your wager will be profitable.

In this last table I've provided the empirical data for the profitability of every divisor between 2 and 20. For a divisor of N the bet is that you'll pay $N-1 if the margin is divisible by N and you'll receive $1 if it isn't. The left column shows the profit if you'd settled the bet at quarter-time, and the right column if you'd settled it all full-time.

As the divisor gets larger, the proposer benefits from the near-certainty that the frequency of an exactly-divisible margin will be smaller than what's required for profitability; he or she also benefits more from the "extra margins" effect since there are likely to be more of them and, for the situation where the bet is being settled at quarter-time, these extra margins are more likely to include a significant number of games.

Consider, for example, the bet for a divisor of 20. For that wager, even if the proportion of games ending the quarter with margins of 20, 40 or 60 points is about one-twentieth the total proportion ending with a margin of 60 points or less, the bet proposer has all the margins from 61 to 71 points in his or her favour. That, as it turns out, is about another 11 games, or almost 0.1%. Every little bit helps.

Which Teams Are Most Likely to Make Next Year's Finals?

I had a little time on a flight back to Sydney from Melbourne last Friday night to contemplate life's abiding truths. So naturally I wondered: how likely is it that a team finishing in ladder position X at the end of one season makes the finals in the subsequent season?

Here's the result for seasons 2000 to 2010, during which the AFL has always had a final 8:

2010 - Probability of Making the Finals by Ladder Position.png

When you bear in mind that half of the 16 teams have played finals in each season since 2000 this table is pretty eye-opening. It suggests that the only teams that can legitimately feel themselves to be better-than-random chances for a finals berth in the subsequent year are those that have finished in the top 4 ladder positions in the immediately preceding season. Historically, top 4 teams have made the 8 in the next year about 70% of the time - 100% of the time in the case of the team that takes the minor premiership.

In comparison, teams finishing 5th through 14th have, empirically, had roughly a 50% chance of making the finals in the subsequent year (actually, a tick under this, which makes them all slightly less than random chances to make the 8).

Teams occupying 15th and 16th have had very remote chances of playing finals in the subsequent season. Only one team from those positions - Collingwood, who finished 15th in 2005 and played finals in 2006 - has made the subsequent year's top 8.

Of course, next year we have another team, so that's even worse news for those teams that finished out of the top 4 this year.

Coast-to-Coast Blowouts: Who's Responsible and When Do They Strike?

Previously, I created a Game Typology for home-and-away fixtures and then went on to use that typology to characterise whole seasons and eras.

In this blog we'll use that typology to investigate the winning and losing tendencies of individual teams and to consider how the mix of different game types varies as the home-and-away season progresses.

First, let's look at the game type profile of each team's victories and losses in season 2010.

2010 - Game Type by Team 2010.png

Five teams made a habit of recording Coast-to-Coast Comfortably victories this season - Carlton, Collingwood, Geelong, Sydney and the Western Bulldogs - all of them finalists, and all of them winning in this fashion at least 5 times during the season.

Two other finalists, Hawthorn and the Saints, were masters of the Coast-to-Coast Nail-Biter. They, along with Port Adelaide, registered four or more of this type of win.

Of the six other game types there were only two that any single team recorded on 4 occasions. The Roos managed four Quarter 2 Press Light victories, and Geelong had four wins categorised as Quarter 3 Press victories.

Looking next at loss typology, we find six teams specialising in Coast-to-Coast Comfortably losses. One of them is Carlton, who also appeared on the list of teams specialising in wins of this variety, reinforcing the point that I made in an earlier blog about the Blues' fate often being determined in 2010 by their 1st quarter performance.

The other teams on the list of frequent Coast-to-Coast Comfortably losers are, unsurprisingly, those from positions 13 through 16 on the final ladder, and the Roos. They finished 9th on the ladder but recorded a paltry 87.4 percentage, this the logical consequence of all those Coast-to-Coast Comfortably losses.

Collingwood and Hawthorn each managed four losses labelled Coast-to-Coast Nail-Biters, and West Coast lost four encounters that were Quarter 2 Press Lights, and four more that were 2nd-Half Revivals where they weren't doing the reviving.

With only 22 games to consider for each team it's hard to get much of a read on general tendencies. So let's increase the sample by an order of magnitude and go back over the previous 10 seasons.

2010 - Game Type by Team 2001-2010.png

Adelaide's wins have come disproportionately often from presses in the 1st or 2nd quarters and relatively rarely from 2nd-Half Revivals or Coast-to-Coast results. They've had more than their expected share of losses of type Q2 Press Light, but less than their share of Q1 Press and Coast-to-Coast losses. In particular, they've suffered few Coast-to-Coast Blowout losses.

Brisbane have recorded an excess of Coast-to-Coast Comfortably and Blowout victories and less Q1 Press, Q3 Press and Coast-to-Coast Nail-Biters than might be expected. No game type has featured disproportionately more often amongst their losses, but they have had relatively few Q2 Press and Q3 Press losses.

Carlton has specialised in the Q2 Press victory type and has, relatively speaking, shunned Q3 Press and Coast-to-Coast Blowout victories. Their losses also include a disportionately high number of Q2 Press losses, which suggests that, over the broader time horizon of a decade, Carlton's fate has been more about how they've performed in the 2nd term. Carlton have also suffered a disproportionately high share of Coast-to-Coast Blowouts - which is I suppose what a Q2 Press loss might become if it gets ugly - yet have racked up fewer than the expected number of Coast-to-Coast Nail-Biters and Coast-to-Coast Comfortablys. If you're going to lose Coast-to-Coast, might as well make it a big one.

Collingwood's victories have been disproportionately often 2nd-Half Revivals or Coast-to-Coast Blowouts and not Q1 Presses or Coast-to-Coast Nail-Biters. Their pattern of losses has been partly a mirror image of their pattern of wins, with a preponderance of Q1 Presses and Coast-to-Coast Nail-Biters and a scarcity of 2nd-Half Revivals. They've also, however, had few losses that were Q2 or Q3 Presses or that were Coast-to-Coast Comfortablys.

Wins for Essendon have been Q1 Presses or Coast-to-Coast Nail-Biters unexpectedly often, but have been Q2 Press Lights or 2nd-Half Revivals significantly less often than for the average team. The only game type overrepresented amongst their losses has been the Coast-to-Coast Comfortably type, while Coast-to-Coast Blowouts, Q1 Presses and, especially, Q2 Presses have been signficantly underrepresented.

Fremantle's had a penchant for leaving their runs late. Amongst their victories, Q3 Presses and 2nd-Half Revivals occur more often than for the average team, while Coast-to-Coast Blowouts are relatively rare. Their losses also have a disproportionately high showing of 2nd-Half Revivals and an underrepresentation of Coast-to-Coast Blowouts and Coast-to-Coast Nail-Biters. It's fair to say that Freo don't do Coast-to-Coast results.

Geelong have tended to either dominate throughout a game or to leave their surge until later. Their victories are disproportionately of the Coast-to-Coast Blowout and Q3 Press varieties and are less likely to be Q2 Presses (Regular or Light) or 2nd-Half Revivals. Losses have been Q2 Press Lights more often than expected, and Q1 Presses, Q3 Presses or Coast-to-Coast Nail-Biters less often than expected.

Hawthorn have won with Q2 Press Lights disproportionately often, but have recorded 2nd-Half Revivals relatively infrequently and Q2 Presses very infrequently. Q2 Press Lights are also overrepresented amongst their losses, while Q2 Presses and Coast-to-Coast Nail-Biters appear less often than would be expected.

The Roos specialise in Coast-to-Coast Nail-Biter and Q2 Press Light victories and tend to avoid Q2 and Q3 Presses, as well as Coast-to-Coast Comfortably and Blowout victories. Losses have come disproportionately from the Q3 Press bucket and relatively rarely from the Q2 Press (Regular or Light) categories. The Roos generally make their supporters wait until late in the game to find out how it's going to end.

Melbourne heavily favour the Q2 Press Light style of victory and have tended to avoid any of the Coast-to-Coast varieties, especially the Blowout variant. They have, however, suffered more than their share of Coast-to-Coast Comfortably losses, but less than their share of Coast-to-Coast Blowout and Q2 Press Light losses.

Port Adelaide's pattern of victories has been a bit like Geelong's. They too have won disproportionately often via Q3 Presses or Coast-to-Coast Blowouts and their wins have been underrepresented in the Q2 Press Light category. They've also been particularly prone to Q2 and Q3 Press losses, but not to Q1 Presses or 2nd-Half Revivals.

Richmond wins have been disproportionately 2nd-Half Revivals or Coast-to-Coast Nail-Biters, and rarely Q1 or Q3 Presses. Their losses have been Coast-to-Coast Blowouts disproportionately often, but Coast-to-Coast Nail-Biters and Q2 Press Lights relatively less often than expected.

St Kilda have been masters of the foot-to-the-floor style of victory. They're overrepresented amongst Q1 and Q2 Presses, as well as Coast-to-Coast Blowouts, and underrepresented amongst Q3 Presses and Coast-to-Coast Comfortablys. Their losses include more Coast-to-Coast Nail-Biters than the average team, and fewer Q1 and Q3 Presses, and 2nd-Half Revivals.

Sydney's loss profile almost mirrors the average team's with the sole exception being a relative abundance of Q3 Presses. Their profile of losses, however, differs significantly from the average and shows an excess of Q1 Presses, 2nd-Half Revivals and Coast-to-Coast Nail-Biters, a relative scarcity of Q3 Presses and Coast-to-Coast Comfortablys, and a virtual absence of Coast-to-Coast Blowouts.

West Coast victories have come disproportionately as Q2 Press Lights and have rarely been of any other of the Press varieties. In particular, Q2 Presses have been relatively rare. Their losses have all too often been Coast-to-Coast blowouts or Q2 Presses, and have come as Coast-to-Coast Nail-Biters relatively infrequently.

The Western Bulldogs have won with Coast-to-Coast Comfortablys far more often than the average team, and with the other two varieties of Coast-to-Coast victories far less often. Their profile of losses mirrors that of the average team excepting that Q1 Presses are somewhat underrepresented.

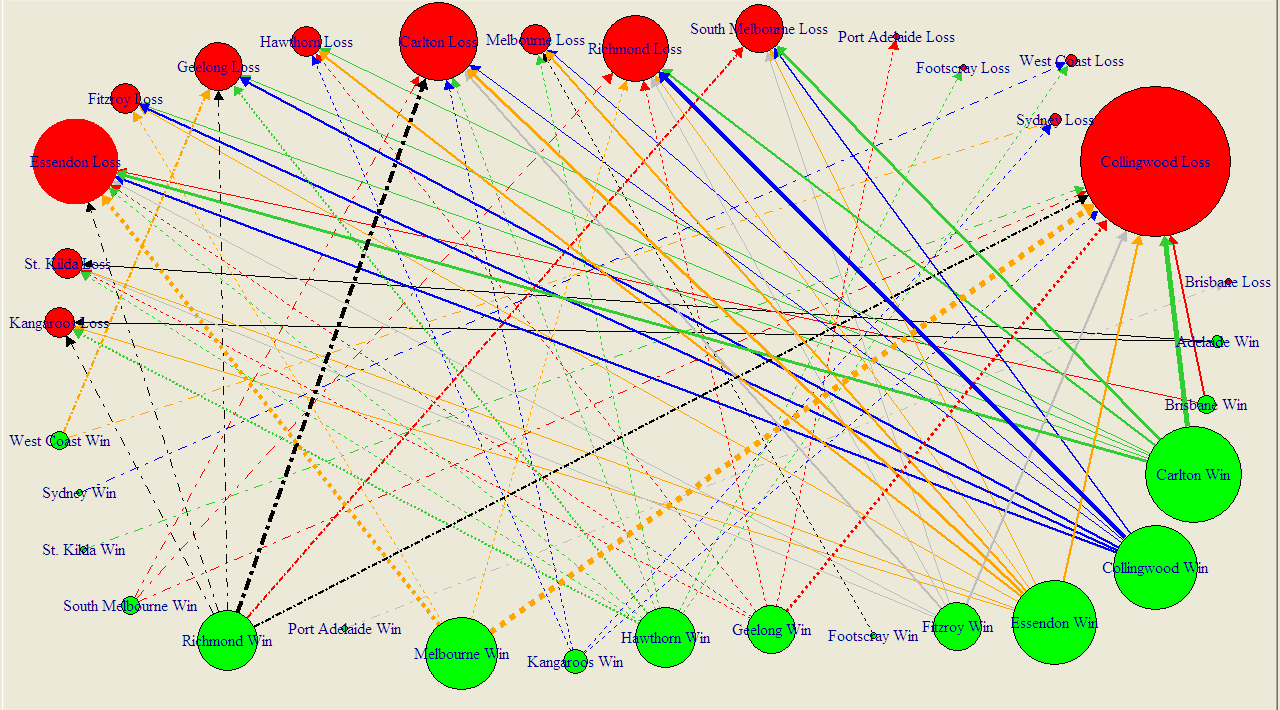
We move now from associating teams with various game types to associating rounds of the season with various game types.

You might wonder, as I did, whether different parts of the season tend to produce a greater or lesser proportion of games of particular types. Do we, for example, see more Coast-to-Coast Blowouts early in the season when teams are still establishing routines and disciplines, or later on in the season when teams with no chance meet teams vying for preferred finals berths?

2010 - Game Type by Round 2001-2010.png

For this chart, I've divided the seasons from 2001 to 2010 into rough quadrants, each spanning 5 or 6 rounds.

The Coast-to-Coast Comfortably game type occurs most often in the early rounds of the season, then falls away a little through the next two quadrants before spiking a little in the run up to the finals.

The pattern for the Coast-to-Coast Nail-Biter game type is almost the exact opposite. It's relatively rare early in the season and becomes more prevalent as the season progresses through its middle stages, before tapering off in the final quadrant.

Coast-to-Coast Blowouts occur relatively infrequently during the first half of the season, but then blossom, like weeds, in the second half, especially during the last 5 rounds when they reach near-plague proportions.

Quarter 1 and Quarter 2 Presses occur with similar frequencies across the season, though they both show up slightly more often as the season progresses. Quarter 2 Press Lights, however, predominate in the first 5 rounds of the season and then decline in frequency across rounds 6 to 16 before tapering dramatically in the season's final quadrant.

Quarter 3 Presses occur least often in the early rounds, show a mild spike in Rounds 6 to 11, and then taper off in frequency across the remainder of the season. 2nd-Half Revivals show a broadly similar pattern.

2010: Just How Different Was It?

Last season I looked at Grand Final Typology. In this blog I'll start by presenting a similar typology for home-and-away games.

In creating the typology I used the same clustering technique that I used for Grand Finals - what's called Partitioning Around Medoids, or PAM - and I used similar data. Each of the 13,144 home-and-away season games was characterised by four numbers: the winning team's lead at quarter time, at half-time, at three-quarter time, and at full time.

With these four numbers we can calculate a measure of distance between any pair of games and then use the matrix of all these distances to form clusters or types of games.

After a lot of toing, froing, re-toing anf re-froing, I settled on a typology of 8 game types:

2010 - Types of Home and Away Game.png

Typically, in the Quarter 1 Press game type, the eventual winning team "presses" in the first term and leads by about 4 goals at quarter-time. At each subsequent change and at the final siren, the winning team typically leads by a little less than the margin it established at quarter-time. Generally the final margin is about about 3 goals. This game type occurs about 8% of the time.

In a Quarter 2 Press game type the press is deferred, and the eventual winning team typically trails by a little over a goal at quarter-time but surges in the second term to lead by four-and-a-half goals at the main break. They then cruise in the third term and extend their lead by a little in the fourth and ultimately win quite comfortably, by about six and a half goals. About 7% of all home-and-away games are of this type.

The Quarter 2 Press Light game type is similar to a Quarter 2 Press game type, but the surge in the second term is not as great, so the eventual winning team leads at half-time by only about 2 goals. In the second half of a Quarter 2 Press Light game the winning team provides no assurances for its supporters and continues to lead narrowly at three-quarter time and at the final siren. This is one of the two most common game types, and describes almost 1 in 5 contests.

Quarter 3 Press games are broadly similar to Quarter 1 Press games up until half-time, though the eventual winning team typically has a smaller lead at that point in a Quarter 3 Press game type. The surge comes in the third term where the winners typically stretch their advantage to around 7 goals and then preserve this margin until the final siren. Games of this type comprise about 10% of home-and-away fixtures.

2nd-Half Revival games are particularly closely fought in the first two terms with the game's eventual losers typically having slightly the better of it. The eventual winning team typically trails by less than a goal at quarter-time and at half-time before establishing about a 3-goal lead at the final change. This lead is then preserved until the final siren. This game type occurs about 13% of the time.

A Coast-to-Coast Nail-Biter is the game type that's the most fun to watch - provided it doesn't involve your team, especially if your team's on the losing end of one of these contests. In this game type the same team typically leads at every change, but by less than a goal to a goal and a half. Across history, this game type has made up about one game in six.

The Coast-to-Coast Comfortably game type is fun to watch as a supporter when it's your team generating the comfort. Teams that win these games typically lead by about two and a half goals at quarter-time, four and a half goals at half-time, six goals at three-quarter time, and seven and a half goals at the final siren. This is another common game type - expect to see it about 1 game in 5 (more often if you're a Geelong or a West Coast fan, though with vastly differing levels of pleasure depending on which of these two you support).

Coast-to-Coast Blowouts are hard to love and not much fun to watch for any but the most partial observer. They start in the manner of a Coast-to-Coast Comfortably game, with the eventual winner leading by about 2 goals at quarter time. This lead is extended to six and a half goals by half-time - at which point the word "contest" no longer applies - and then further extended in each of the remaining quarters. The final margin in a game of this type is typically around 14 goals and it is the least common of all game types. Throughout history, about one contest in 14 has been spoiled by being of this type.

Unfortunately, in more recent history the spoilage rate has been higher, as you can see in the following chart (for the purposes of which I've grouped the history of the AFL into eras each of 12 seasons, excepting the most recent era, which contains only 6 seasons. I've also shown the profile of results by game type for season 2010 alone).

2010 - Profile of Game Types by Era.png

The pies in the bottom-most row show the progressive growth in the Coast-to-Coast Blowout commencing around the 1969-1980 era and reaching its apex in the 1981-1992 era where it described about 12% of games.

In the two most-recent eras we've seen a smaller proportion of Coast-to-Coast Blowouts, but they've still occurred at historically high rates of about 8-10%.

We've also witnessed a proliferation of Coast-to-Coast Comfortably and Coast-to-Coast Nail-Biter games in this same period, not least of which in the current season where these game type descriptions attached to about 27% and 18% of contests respectively.

In total, almost 50% of the games this season were Coast-to-Coast contests - that's about 8 percentage points higher than the historical average.

Of the five non Coast-to-Coast game types, three - Quarter 2 Press, Quarter 3 Press and 2nd-half Revival - occurred at about their historical rates this season, while Quarter 1 Press and Quarter 2 Press Light game typesboth occurred at about 75-80% of their historical rates.

The proportion of games of each type in a season can be thought of as a signature of that season. being numeric, they provide a ready basis on which to measure how much one season is more or less like another. In fact, using a technique called principal components analysis we can use each season's signature to plot that season in two-dimensional space (using the first two principal components).

Here's what we get:

2010 - Home and Away Season Similarity.png

I've circled the point labelled "2010", which represents the current season. The further away is the label for another season, the more different is that season's profile of game types in comparison to 2010's profile.

So, for example, 2009, 1999 and 2005 are all seasons that were quite similar to 2010, and 1924, 1916 and 1958 are all seasons that were quite different. The table below provides the profile for each of the seasons just listed; you can judge the similarity for yourself.

2010 - Seasons Similar to 2010.png

Signatures can also be created for eras and these signatures used to represent the profile of game results from each era. If you do this using the eras as I've defined them, you get the chart shown below.

One way to interpret this chart is that there have been 3 super-eras in VFL/AFL history, the first spanning the seasons from 1897 to 1920, the second from 1921-1980, and the third from 1981-2010. In this latter era we seem to be returning to the profiles of the earliest eras, which was a time when 50% or more of all results were Coast-to-Coast game types.

2010 - Home and Away Era Similarity.png

Season 2010: An Assessment of Competitiveness

For many, the allure of sport lies in its uncertainty. It's this instinct, surely, that motivated the creation of the annual player drafts and salary caps - the desire to ensure that teams don't become unbeatable, that "either team can win on the day".

Objective measures of the competitiveness of AFL can be made at any of three levels: teams' competition wins and losses, the outcome of a game, or the in-game trading of the lead.

With just a little pondering, I came up with the following measures of competitiveness at the three levels; I'm sure there are more.

2010 - Measures of Competitiveness.png

We've looked at most - maybe all - of the Competition and Game level measures I've listed here in blogs or newsletters of previous seasons. I'll leave any revisiting of these measures for season 2010 as a topic for a future blog.

The in-game measures, though, are ones we've not explicitly explored, though I think I have commented on at least one occasion this year about the surprisingly high proportion of winning teams that have won 1st quarters and the low proportion of teams that have rallied to win after trailing at the final change.

As ever, history provides some context for my comments.

2010 - Number of Lead Changes.png

The red line in this chart records the season-by-season proportion of games in which the same team has led at every change. You can see that there's been a general rise in the proportion of such games from about 50% in the late seventies to the 61% we saw this year.

In recent history there have only been two seasons where the proportion of games led by the same team at every change has been higher: in 1995, when it was almost 64%, and in 1985 when it was a little over 62%. Before that you need to go back to 1925 to find a proportion that's higher than what we've seen in 2010.

The green, purple and blue lines track the proportion of games for which there were one, two, and the maximum possible three lead changes respectively. It's also interesting to note how the lead-change-at-every-change contest type has progressively disappeared into virtual non-existence over the last 50 seasons. This year we saw only three such contests, one of them (Fremantle v Geelong) in Round 3, and then no more until a pair of them (Fremantle v Geelong and Brisbane v Adelaide) in Round 20.

So we're getting fewer lead changes in games. When, exactly, are these lead changes not happening?

2010 - Lead Changes from One Quarter to the Next.png

Pretty much everywhere, it seems, but especially between the ends of quarters 1 and 2.

The top line shows the proportion of games in which the team leading at half time differs from the team leading at quarter time (a statistic that, as for all the others in this chart, I've averaged over the preceding 10 years to iron out the fluctuations and better show the trend). It's been generally falling since the 1960s excepting a brief period of stability through the 1990s that recent seasons have ignored, the current season in particular during which it's been just 23%.

Next, the red line, which shows the proportion of games in which the team leading at three-quarter time differs from the team leading at half time. This statistic has declined across the period roughly covering the 1980s through to 2000, since which it has stabilised at about 20%.

The navy blue line shows the proportion of games in which the winning team differs from the team leading at three-quarter time. Its trajectory is similar to that of the red line, though it doesn't show the jaunty uptick in recent seasons that the red line does.

Finally, the dotted, light-blue line, which shows the overall proportion of quarters for which the team leading at one break was different from the team leading at the previous break. Its trend has been downwards since the 1960s though the rate of decline has slowed markedly since about 1990.

All told then, if your measure of AFL competitiveness is how often the lead changes from the end of one quarter to the next, you'd have to conclude that AFL games are gradually becoming less competitive.

It'll be interesting to see how the introduction of new teams over the next few seasons affects this measure of competitiveness.

A Competition of Two Halves

In the previous blog I suggested that, based on winning percentages when facing finalists, the top 8 teams (well, actually the top 7) were of a different class to the other teams in the competition.

Current MARS Ratings provide further evidence for this schism. To put the size of the difference in an historical perspective, I thought it might be instructive to review the MARS Ratings of teams at a similar point in the season for each of the years 1999 to 2010.

(This also provides me an opportunity to showcase one of the capabilities - strip-charts - of a sparklines tool that can be downloaded for free and used with Excel.)

2010 - Spread of MARS Ratings by Year.png

In the chart, each row relates the MARS Ratings that the 16 teams had as at the end of Round 22 in a particular season. Every strip in the chart corresponds to the Rating of a single team, and the relative position of that strip is based on the team's Rating - the further to the right the strip is, the higher the Rating.

The red strip in each row corresponds to a Rating of 1,000, which is always the average team Rating.

While the strips provide a visual guide to the spread of MARS Ratings for a particular season, the data in the columns at right offer another, more quantitative view. The first column is the average Rating of the 8 highest-rated teams, the middle column the average Rating of the 8 lowest-rated teams, and the right column is the difference between the two averages. Larger values in this right column indicate bigger differences in the MARS Ratings of teams rated highest compared to those rated lowest.

(I should note that the 8 highest-rated teams will not always be the 8 finalists, but the differences in the composition of these two sets of eight team don't appear to be material enough to prevent us from talking about them as if they were interchangeable.)

What we see immediately is that the difference in the average Rating of the top and bottom teams this year is the greatest that it's been during the period I've covered. Furthermore, the difference has come about because this year's top 8 has the highest-ever average Rating and this year's bottom 8 has the lowest-ever average Rating.

The season that produced the smallest difference in average Ratings was 1999, which was the year in which 3 teams finished just one game out of the eight and another finished just two games out. That season also produced the all-time lowest rated top 8 and highest rated bottom 8.

While we're on MARS Ratings and adopting an historical perspective (and creating sparklines), here's another chart, this one mapping the ladder and MARS performances of the 16 teams as at the end of the home-and-away seasons of 1999 to 2010.

2010 - MARS and Ladder History - 1999-2010.png

One feature of this chart that's immediately obvious is the strong relationship between the trajectory of each team's MARS Rating history and its ladder fortunes, which is as it should be if the MARS Ratings mean anything at all.

Other aspects that I find interesting are the long-term decline of the Dons, the emergence of Collingwood, Geelong and St Kilda, and the precipitous rise and fall of the Eagles.

I'll finish this blog with one last chart, this one showing the MARS Ratings of the teams finishing in each of the 16 ladder positions across seasons 1999 to 2010.

2010 - MARS Ratings Spread by Ladder Position.png

As you'd expect - and as we saw in the previous chart on a team-by-team basis - lower ladder positions are generally associated with lower MARS Ratings.

But the "weather" (ie the results for any single year) is different from the "climate" (ie the overall correlation pattern). Put another way, for some teams in some years, ladder position and MARS Rating are measuring something different. Whether either, or neither, is measuring what it purports to -relative team quality - is a judgement I'll leave in the reader's hands.

Looking At Team Performance Quarter-By-Quarter

AFL Football - as the cliche goes - is a game of four quarters. The benefit of this arrangement is that AFL scores provide twice as much information about the ebb and flow of each contest as the scores of any other form of football in this country. With the quarter-by-quarter information alone we can perform some interesting analyses for every team.
Read More

Goalkicking Accuracy Across The Seasons

Last weekend's goal-kicking was strikingly poor, as I commented in the previous blog, and this led me to wonder about the trends in kicking accuracy across football history. Just about every sport I can think of has seen significant improvements in the techniques of those playing and this has generally led to improved performance. If that applies to football then we could reasonably expect to see higher levels of accuracy across time.
Read More

Grand Final Typology

Today's blog looks at the typology of AFL Grand Finals. There are, it turns out, five basic types: (1) The Coast-to-Coast Coasting victory (2) The Come-From-Behind victory (3) The Game-of-Two-Halves Victory (4) The Coast-to-Coast Blowout Victory (5) The Nervous Start Victory
Read More

Grand Finals: Points Scoring and Margins

How would you characterise the Grand Finals that you've witnessed? As low-scoring, closely fought games; as high-scoring games with regular blow-out finishes; or as something else?

First let's look at the total points scored in Grand Finals relative to the average points scored per game in the season that immediately preceded them.

GF_PPG.png

Apart from a period spanning about the first 25 years of the competition, during which Grand Finals tended to be lower-scoring affairs than the matches that took place leading up to them, Grand Finals have been about as likely to produce more points than the season average as to produce fewer points.

One way to demonstrate this is to group and summarise the Grand Finals and non-Grand Finals by the decade in which they occurred.

GF_PPG_CHT.png

There's no real justification then, it seems, in characterising them as dour affairs.

That said, there have been a number of Grand Finals that failed to produce more than 150 points between the two sides - 49 overall, but only 3 of the last 30. The most recent of these was the 2005 Grand Final in which Sydney's 8.10 (58) was just good enough to trump the Eagles' 7.12 (54). Low-scoring, sure, but the sort of game for which the cliche "modern-day classic" was coined.

To find the lowest-scoring Grand Final of all time you'd need to wander back to 1927 when Collingwood 2.13 (25) out-yawned Richmond 1.7 (13). Collingwood, with efficiency in mind, got all of its goal-scoring out of the way by the main break, kicking 2.6 (20) in the first half. Richmond, instead, left something in the tank, going into the main break at 0.4 (4) before unleashing a devastating but ultimately unsuccessful 1.3 (9) scoring flurry in the second half.

That's 23 scoring shots combined, only 3 of them goals, comprising 12 scoring shots in the first half and 11 in the second. You could see that many in an under 10s soccer game most weekends.

Forty-five years later, in 1972, Carlton and Richmond produced the highest-scoring Grand Final so far. In that game, Carlton 28.9 (177) held off a fast-finishing Richmond 22.18 (150), with Richmond kicking 7.3 (45) to Carlton's 3.0 (18) in the final term.

Just a few weeks earlier these same teams had played out an 8.13 (63) to 8.13 (63) draw in their Semi Final. In the replay Richmond prevailed 15.20 (110) to Carlton's 9.15 (69) meaning that, combined, the two Semi Finals they played generated 22 points fewer than did the Grand Final.

From total points we turn to victory margins.

Here too, again save for a period spanning about the first 35 years of the competition during which GFs tended to be closer fought than the average games that had gone before them, Grand Finals have been about as likely to be won by a margin smaller than the season average as to be won by a greater margin.

GF_MPG.png

Of the 10 most recent Grand Finals, 5 have produced margins smaller than the season average and 5 have produced greater margins.

Perhaps a better view of the history of Grand Final margins is produced by looking at the actual margins rather than the margins relative to the season average. This next table looks at the actual margins of victory in Grand Finals summarised by decade.

GF_MOV.png

One feature of this table is the scarcity of close finishes in Grand Finals of the 1980s, 1990s and 2000s. Only 4 of these Grand Finals have produced a victory margin of less than 3 goals. In fact, 19 of the 29 Grand Finals have been won by 5 goals or more.

An interesting way to put this period of generally one-sided Grand Finals into historical perspective is provided by this, the final graphic for today.

GF_MOV_PC.png

They just don't make close Grand Finals like they used to.

A First Look at Grand Final History

In Preliminary Finals since 2000 teams finishing in ladder position 1 are now 3-0 over teams finishing 3rd, and teams finishing in ladder position 2 are 5-0 over teams finishing 4th.

Overall in Preliminary Finals, teams finishing in 1st now have a 70% record, teams finishing 2nd an 80% record, teams finishing 3rd a 38% record, and teams finishing 4th a measly 20% record. This generally poor showing by teams from 3rd and 4th has meant that we've had at least 1 of the top 2 teams in every Grand Final since 2000.

Finals_Summary_Wk3.png

Reviewing the middle table in the diagram above we see that there have been 4 Grand Finals since 2000 involving the teams from 1st and 2nd on the ladder and these contests have been split 2 apiece. No other pairing has occurred with a greater frequency.

Two of these top-of-the-table clashes have come in the last 2 seasons, with 1st-placed Geelong defeating 2nd-placed Port Adelaide in 2007, and 2nd-placed Hawthorn toppling 1st-placed Geelong last season. Prior to that we need to go back firstly to 2004, when 1st-placed Port Adelaide defeated 2nd-placed Brisbane Lions, and then to 2001 when 1st-placed Essendon surrendered to 2nd-placed Brisbane Lions.

Ignoring the replays of 1948 and 1977 there have been 110 Grand Finals in the 113-year history of the VFL/AFL history, with Grand Finals not being used in the 1897 or 1924 seasons. The pairings and win-loss records for each are shown in the table below.

GF_Records.png

As you can see, this is the first season that St Kilda have met Geelong in the Grand Final. Neither team has been what you'd call a regular fixture at the G come Grand Final Day, though the Cats can lay claim to having been there more often (15 times to the Saints' 5) and to having a better win-loss percentage (47% to the Saints' 20%).

After next weekend the Cats will move ahead of Hawthorn into outright 7th in terms of number of GF appearances. Even if they win, however, they'll still trail the Hawks by 2 in terms of number of Flags.

MARS Ratings of the Finalists

We've had a cracking finals series so far and there's the prospect of even better to come. Two matches that stand out from what we've already witnessed are the Lions v Carlton and Collingwood v Adelaide games. A quick look at the Round 22 MARS ratings of these teams tells us just how evenly matched they were.

MARS_Finalists_F2.png

Glancing down to the bottom of the 2009 column tells us a bit more about the quality of this year's finalists.

As a group, their average rating is 1,020.8, which is the 3rd highest average rating since season 2000, behind only the averages for 2001 and 2003, and weighed down by the sub-1000 rating of the eighth-placed Dons.

At the top of the 8, the quality really stands out. The top 4 teams have the highest average rating for any season since 2000, and the top 5 teams are all rated 1,025 or higher, a characteristic also unique to 2009.

Someone from among that upper eschelon had to go out in the first 2 weeks and, as we now know, it was Adelaide, making them the highest MARS rated team to finish fifth at the end of the season.

MARS_Finalists_F2_2.png

(Adelaide aren't as unlucky as the Carlton side of 2001, however, who finished 6th with a MARS Rating of 1,037.9)

A Decade of Finals

This year represents the 10th under the current system of finals, a system I think has much to recommend it. It certainly seems to - justifiably, I'd argue - favour those teams that have proven their credentials across the entire season.

The table below shows how the finals have played out over the 10 years:

Finals_2009_W1.png

This next table summarises, on a one-week-of-the-finals-at-a-time basis, how teams from each ladder position have fared:

Finals_Summary_Wk1.png

Of particular note in relation to Week 1 of the finals is the performance of teams finishing 3rd and of those finishing 7th. Only two such teams - one from 3rd and one from 7th - have been successful in their respective Qualifying and Elimination Finals.

In the matchups of 1st v 4th and 5th v 8th the outcomes have been far more balanced. In the 1st v 4th clashes, it's been the higher ranked team that has prevailed on 6 of 10 occasions, whereas in the 5th v 8th clashes, it's been the lower ranked team that's won 60% of the time.

Turning our attention next to Week 2 of the finals, we find that the news isn't great for Adelaide or Lions fans. On both those occasions when 4th has met 5th in Week 2, the team from 4th on the ladder has emerged victorious, and on the 7 occasions that 3rd has faced 6th in Week 2, the team from 3rd on the ladder has won 5 and lost only 2.

Looking more generally at the finals, it's interesting to note that no team from ladder positions 5, 7 or 8 has made it through to the Preliminary Finals and, on the only two occasions that the team from position 6 has made it that far, none has progressed into the Grand Final.

So, teams only from positions 1 to 4 have so far contested Grand Finals, teams from 1st on 6 occasions, teams from 2nd on 7 occasions, teams from 3rd on 3 occasions, and teams from 4th only twice.

No team finishing lower than 3rd has yet won a Flag.

Game Cadence

If you were to consider each quarter of football as a separate contest, what pattern of wins and losses do you think has been most common? Would it be where one team wins all 4 quarters and the other therefore losses all 4? Instead, might it be where teams alternated, winning one and losing the next, or vice versa? Or would it be something else entirely?

The answer, it turns out, depends on the period of history over which you ask the question. Here's the data:

Game Cadence.png

So, if you consider the entire expanse of VFL/AFL history, the egalitarian "WLWL / LWLW" cadence has been most common, occurring in over 18% of all games. The next most common cadence, coming in at just under 15% is "WWWW / LLLL" - the Clean Sweep, if you will. The next four most common cadences all have one team winning 3 quarters and the other winning the remaining quarter, each of which such cadences have occurred about 10-12% of the time. The other patterns have occurred with frequencies as shown under the 1897 to 2009 columns, and taper off to the rarest of all combinations in which 3 quarters were drawn and the other - the third quarter as it happens - was won by one team and so lost by the other. This game took place in Round 13 of 1901 and involved Fitzroy and Collingwood.

If, instead, you were only to consider more recent seasons excluding the current one, say from 1980 to 2008, you'd find that the most common cadence has been the Clean Sweep on about 18%, with the "WLLL / "LWWW" cadence in second on a little over 12%. Four other cadences then follow in the 10-11.5% range, three of them involving one team winning 3 of the 4 quarters and the other the "WLWL / LWLW" cadence.

In short it seems that teams have tended to dominate contests more in the 1980 to 2008 period than had been the case historically.

(It's interesting to note that, amongst those games where the quarters are split 2 each, "WLWL / LWLW" is more common than either of the two other possible cadences, especially across the entire history of footy.)

Turning next to the current season, we find that the Clean Sweep has been the most common cadence, but is only a little ahead of 5 other cadences, 3 of these involving a 3-1 split of quarters and 2 of them involving a 2-2 split.

So, 2009 looks more like the period 1980 to 2008 than it does the period 1897 to 2009.

What about the evidence for within-game momentum in the quarter-to-quarter cadence? In other words, are teams who've won the previous quarter more or less likely to win the next?

Once again, the answer depends on your timeframe.

Across the period 1897 to 2009 (and ignoring games where one of the two relevant quarters was drawn):

  • teams that have won the 1st quarter have also won the 2nd quarter about 46% of the time
  • teams that have won the 2nd quarter have also won the 3rd quarter about 48% of the time
  • teams that have won the 3rd quarter have also won the 4th quarter just under 50% of the time.

So, across the entire history of football, there's been, if anything, an anti-momentum effect, since teams that win one quarter have been a little less likely to win the next.

Inspecting the record for more recent times, however, consistent with our earlier conclusion about the greater tendency for teams to dominate matches, we find that, for the periods 1980 to 2008 (and, in brackets, for 2009):

  • teams that have won the 1st quarter have also won the 2nd quarter about 52% of the time a little less in 2009)
  • teams that have won the 2nd quarter have also won the 3rd quarter about 55% of the time (a little more in 2009)
  • teams that have won the 3rd quarter have also won the 4th quarter just under 55% of the time (but only 46% for 2009).

In more recent history then, there is evidence of within-game momentum.

All of which would lead you to believe that winning the 1st quarter should be particularly important, since it gets the momentum moving in the right direction right from the start. And, indeed, this season that has been the case, as teams that have won matches have also won the 1st quarter in 71% of those games, the greatest proportion of any quarter.

The Decline of the Humble Behind

Last year, you might recall, a spate of deliberately rushed behinds prompted the AFL to review and ultimately change the laws relating to this form of scoring.

Has the change led to a reduction in the number of behinds recorded in each game? The evidence is fairly strong:

Goals and Behinds.png

So far this season we've seen 22.3 behinds per game, which is 2.6 per game fewer than we saw in 2008 and puts us on track to record the lowest number of average behinds per game since 1915. Back then though goals came as much more of a surprise, so a spectator at an average game in 1915 could expect to witness only 16 goals to go along with the 22 behinds. Happy days.

This year's behind decline continues a trend during which the number of behinds per game has dropped from a high of 27.3 per game in 1991 to its current level, a full 5 behinds fewer, interrupted only by occasional upticks such as the 25.1 behinds per game recorded in 2007 and the 24.9 recorded in 2008.

While behind numbers have been falling recently, goals per game have also trended down - from 29.6 in 1991, to this season's current average of 26.8. Still, AFL followers can expect to witness more goals than behinds in most games they watch. This wasn't always the case. Not until the season of 1969 had there been a single season with more goals than behinds, and not until 1976 did such an outcome became a regular occurrence. In only one season since then, 1981, have fans endured more behinds than goals across the entire season.

On a game-by-game basis, 90 of 128 games this season, or a smidge over 70%, have produced more goals than behinds. Four more games have produced an equal number of each.

As a logical consequence of all these trends, behinds have had a significantly smaller impact on the result of games, as evidenced by the chart below which shows the percentage of scoring attributable to behinds falling from above 20% in the very early seasons to around 15% across the period 1930 to 1980, to this season's 12.2%, the second-lowest percentage of all time, surpassed only by the 11.9% of season 2000.

Behinds PC.png

(There are more statistical analyses of the AFL on MAFL Online's sister site at MAFL Stats.)