2010: Just How Different Was It?
/Last season I looked at Grand Final Typology. In this blog I'll start by presenting a similar typology for home-and-away games.
In creating the typology I used the same clustering technique that I used for Grand Finals - what's called Partitioning Around Medoids, or PAM - and I used similar data. Each of the 13,144 home-and-away season games was characterised by four numbers: the winning team's lead at quarter time, at half-time, at three-quarter time, and at full time.
With these four numbers we can calculate a measure of distance between any pair of games and then use the matrix of all these distances to form clusters or types of games.
After a lot of toing, froing, re-toing anf re-froing, I settled on a typology of 8 game types:

Typically, in the Quarter 1 Press game type, the eventual winning team "presses" in the first term and leads by about 4 goals at quarter-time. At each subsequent change and at the final siren, the winning team typically leads by a little less than the margin it established at quarter-time. Generally the final margin is about about 3 goals. This game type occurs about 8% of the time.
In a Quarter 2 Press game type the press is deferred, and the eventual winning team typically trails by a little over a goal at quarter-time but surges in the second term to lead by four-and-a-half goals at the main break. They then cruise in the third term and extend their lead by a little in the fourth and ultimately win quite comfortably, by about six and a half goals. About 7% of all home-and-away games are of this type.
The Quarter 2 Press Light game type is similar to a Quarter 2 Press game type, but the surge in the second term is not as great, so the eventual winning team leads at half-time by only about 2 goals. In the second half of a Quarter 2 Press Light game the winning team provides no assurances for its supporters and continues to lead narrowly at three-quarter time and at the final siren. This is one of the two most common game types, and describes almost 1 in 5 contests.
Quarter 3 Press games are broadly similar to Quarter 1 Press games up until half-time, though the eventual winning team typically has a smaller lead at that point in a Quarter 3 Press game type. The surge comes in the third term where the winners typically stretch their advantage to around 7 goals and then preserve this margin until the final siren. Games of this type comprise about 10% of home-and-away fixtures.
2nd-Half Revival games are particularly closely fought in the first two terms with the game's eventual losers typically having slightly the better of it. The eventual winning team typically trails by less than a goal at quarter-time and at half-time before establishing about a 3-goal lead at the final change. This lead is then preserved until the final siren. This game type occurs about 13% of the time.
A Coast-to-Coast Nail-Biter is the game type that's the most fun to watch - provided it doesn't involve your team, especially if your team's on the losing end of one of these contests. In this game type the same team typically leads at every change, but by less than a goal to a goal and a half. Across history, this game type has made up about one game in six.
The Coast-to-Coast Comfortably game type is fun to watch as a supporter when it's your team generating the comfort. Teams that win these games typically lead by about two and a half goals at quarter-time, four and a half goals at half-time, six goals at three-quarter time, and seven and a half goals at the final siren. This is another common game type - expect to see it about 1 game in 5 (more often if you're a Geelong or a West Coast fan, though with vastly differing levels of pleasure depending on which of these two you support).
Coast-to-Coast Blowouts are hard to love and not much fun to watch for any but the most partial observer. They start in the manner of a Coast-to-Coast Comfortably game, with the eventual winner leading by about 2 goals at quarter time. This lead is extended to six and a half goals by half-time - at which point the word "contest" no longer applies - and then further extended in each of the remaining quarters. The final margin in a game of this type is typically around 14 goals and it is the least common of all game types. Throughout history, about one contest in 14 has been spoiled by being of this type.
Unfortunately, in more recent history the spoilage rate has been higher, as you can see in the following chart (for the purposes of which I've grouped the history of the AFL into eras each of 12 seasons, excepting the most recent era, which contains only 6 seasons. I've also shown the profile of results by game type for season 2010 alone).

The pies in the bottom-most row show the progressive growth in the Coast-to-Coast Blowout commencing around the 1969-1980 era and reaching its apex in the 1981-1992 era where it described about 12% of games.
In the two most-recent eras we've seen a smaller proportion of Coast-to-Coast Blowouts, but they've still occurred at historically high rates of about 8-10%.
We've also witnessed a proliferation of Coast-to-Coast Comfortably and Coast-to-Coast Nail-Biter games in this same period, not least of which in the current season where these game type descriptions attached to about 27% and 18% of contests respectively.
In total, almost 50% of the games this season were Coast-to-Coast contests - that's about 8 percentage points higher than the historical average.
Of the five non Coast-to-Coast game types, three - Quarter 2 Press, Quarter 3 Press and 2nd-half Revival - occurred at about their historical rates this season, while Quarter 1 Press and Quarter 2 Press Light game typesboth occurred at about 75-80% of their historical rates.
The proportion of games of each type in a season can be thought of as a signature of that season. being numeric, they provide a ready basis on which to measure how much one season is more or less like another. In fact, using a technique called principal components analysis we can use each season's signature to plot that season in two-dimensional space (using the first two principal components).
Here's what we get:
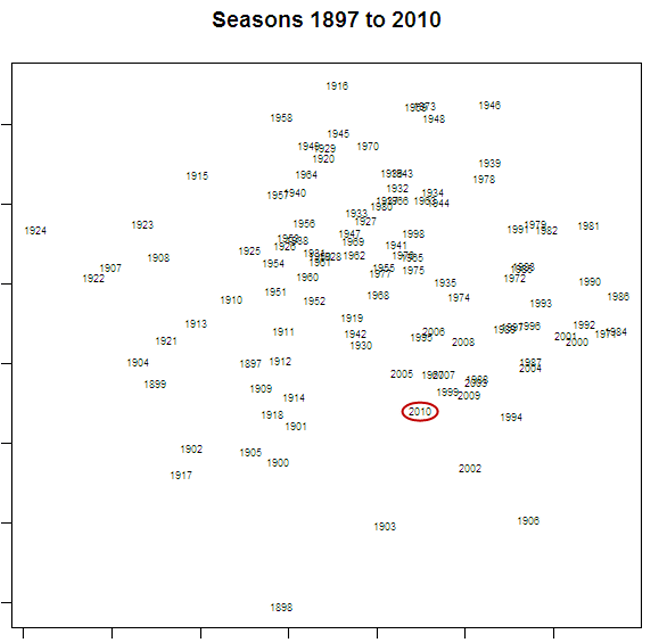
I've circled the point labelled "2010", which represents the current season. The further away is the label for another season, the more different is that season's profile of game types in comparison to 2010's profile.
So, for example, 2009, 1999 and 2005 are all seasons that were quite similar to 2010, and 1924, 1916 and 1958 are all seasons that were quite different. The table below provides the profile for each of the seasons just listed; you can judge the similarity for yourself.

Signatures can also be created for eras and these signatures used to represent the profile of game results from each era. If you do this using the eras as I've defined them, you get the chart shown below.
One way to interpret this chart is that there have been 3 super-eras in VFL/AFL history, the first spanning the seasons from 1897 to 1920, the second from 1921-1980, and the third from 1981-2010. In this latter era we seem to be returning to the profiles of the earliest eras, which was a time when 50% or more of all results were Coast-to-Coast game types.

