A Little Behind in the Scoring

We've not had a proposition bet for a while, so here's a new one for you. We're going to pick a large number of games at random and, based on the half-time score in each, I'll pledge to bet on the team that's scored the greater number of behinds whether they be the raging favourite or the deserving underdog. It both teams have scored the same number of behinds at the main break or if the game ends in a draw, the bet is a push and neither of us need reach into our pockets. Otherwise, I collect if the team that had scored the greater number of behinds at the half goes on win, and you win if the team that had scored the lesser number of behinds at the half goes on win. Simple.
Read More

A Proposition Bet on the Game Margin

We've not had a proposition bet for a while, so here's the bet and a spiel to go with it:

"If the margin at quarter time is a multiple of 6 points I'll pay you $5; if it's not, you pay me a $1. If the two teams are level at quarter-time it's a wash and neither of us pay the other anything.

Now quarter-time margins are unpredictable, so the probability of the margin being a multiple of 6 is 1-in-6, so my offering you odds of 5/1 makes it a fair bet, right? Actually, since goals are worth six points, you've probably got the better of the deal, since you'll collect if both teams kick the same number of behinds in the quarter.

Deal?"

At first glance this bet might look reasonable, but it isn't. I'll take you through the mechanics of why, and suggest a few even more lucrative variations.

Firstly, taking out the drawn quarter scenario is important. Since zero is divisible by 6 - actually, it's divisible by everything but itself - this result would otherwise be a loser for the bet proposer. Historically, about 2.4% of games have been locked up at the end of the 1st quarter, so you want those games off the table.

You could take the high moral ground on removing the zero case too, because your probability argument implicitly assumes that you're ignoring zeroes. If you're claiming that the chances of a randomly selected number being divisible by 6 is 1-in-6 then it's as if you're saying something like the following:

"Consider all the possible margins of 12 goals or less at quarter time. Now twelve of those margins - 6, 12, 18, 24, 30, 36, 42, 48, 54, 60, 66 and 72 - are divisible by 6, and the other 60, excluding 0, are not. So the chances of the margin being divisible by 6 are 12-in-72 or 1-in-6."

In running that line, though, I'm making two more implicit assumptions, one fairly obvious and the other more subtle.

The obvious assumption I'm making is that every margin is equally likely. Demonstrably, it's not. Smaller margins are almost universally more frequent than larger margins. Because of this, the proportion of games with margins of 1 to 5 points is more than 5 times larger than the proportion of games with margins of exactly 6 points, the proportion of games with margins of 7 to 11 points is more than 5 times larger than the proportion of games with margins of exactly 12 points, and so on. It's this factor that, primarily, makes the bet profitable.

The tendency for higher margins to be less frequent is strong, but it's not inviolate. For example, historically more games have had a 5-point margin at quarter time than a 4-point margin, and more have had an 11-point margin than a 10-point margin. Nonetheless, overall, the declining tendency has been strong enough for the proposition bet to be profitable as I've described it.

Here is a chart of the frequency distribution of margins at the end of the 1st quarter.

The far-less obvious assumption in my earlier explanation of the fairness of the bet is that the bet proposer will have exactly five-sixths of the margins in his or her favour; he or she will almost certainly have more than this, albeit only slightly more.

This is because there'll be a highest margin and that highest margin is more likely not to be divisible by 6 than it is to be divisible by 6. The simple reason for this is, as we've already noted, that only one-sixth of all numbers are divisible by six.

So if, for example, the highest margin witnessed at quarter-time is 71 points (which, actually, it is), then the bet proposer has 60 margins in his or her favour and the bet acceptor has only 11. That's 5 more margins in the proposer's favour than the 5/1 odds require, even if every margin was equally likely.

The only way for the ratio of margins in favour of the proposer to those in favour of the acceptor to be exactly 5-to-1 would be for the highest margin to be an exact multiple of 6. In all other cases, the bet proposer has an additional edge (though to be fair it's a very, very small one - about 0.02%).

So why did I choose to settle the bet at the end of the 1st quarter and not instead, say, at the end of the game?

Well, as a game progresses the average margin tends to increase and that reduces the steepness of the decline in frequency with increasing margin size.

Here's the frequency distribution of margins as at game's end.

(As well as the shallower decline in frequencies, note how much less prominent the 1-point game is in this chart compared to the previous one. Games that are 1-point affairs are good for the bet proposer.)

The slower rate of decline when using 4th-quarter rather than 1st-quarter margins makes the wager more susceptible to transient stochastic fluctuations - or what most normal people would call 'bad luck' - so much so that the wager would have been unprofitable in just over 30% of the 114 seasons from 1897 to 2010, including a horror run of 8 losing seasons in 13 starting in 1956 and ending in 1968.

Across all 114 seasons taken as a whole though it would also have been profitable. If you take my proposition bet as originally stated and assume that you'd found a well-funded, if a little slow and by now aged, footballing friend who'd taken this bet since the first game in the first round of 1897, you'd have made about 12c per game from him or her on average. You'd have paid out the $5 about 14.7% of the time and collected the $1 the other 85.3% of the time.

Alternatively, if you'd made the same wager but on the basis of the final margin, and not the margin at quarter-time, then you'd have made only 7.7c per game, having paid out 15.4% of the time and collected the other 84.6% of the time.

One way that you could increase your rate of return, whether you choose the 1st- or 4th-quarter margin as the basis for determining the winner, would be to choose a divisor higher than 6. So, for example, you could offer to pay $9 if the margin at quarter-time was divisible by 10 and collect $1 if it wasn't. By choosing a higher divisor you virtually ensure that there'll be sufficient decline in the frequencies that your wager will be profitable.

In this last table I've provided the empirical data for the profitability of every divisor between 2 and 20. For a divisor of N the bet is that you'll pay $N-1 if the margin is divisible by N and you'll receive $1 if it isn't. The left column shows the profit if you'd settled the bet at quarter-time, and the right column if you'd settled it all full-time.

As the divisor gets larger, the proposer benefits from the near-certainty that the frequency of an exactly-divisible margin will be smaller than what's required for profitability; he or she also benefits more from the "extra margins" effect since there are likely to be more of them and, for the situation where the bet is being settled at quarter-time, these extra margins are more likely to include a significant number of games.

Consider, for example, the bet for a divisor of 20. For that wager, even if the proportion of games ending the quarter with margins of 20, 40 or 60 points is about one-twentieth the total proportion ending with a margin of 60 points or less, the bet proposer has all the margins from 61 to 71 points in his or her favour. That, as it turns out, is about another 11 games, or almost 0.1%. Every little bit helps.

Modelling AFL Team Scoring

Today's blog is the first in a series that will look at statistically modelling the scoring behaviour of teams in the AFL. If you're profoundly reductionist about it, you can think about a team's footy score as being the product of the number of scoring shots it creates and the proportion of those scoring shots that it converts into goals.
Read More

Goalkicking Accuracy Across The Seasons

Last weekend's goal-kicking was strikingly poor, as I commented in the previous blog, and this led me to wonder about the trends in kicking accuracy across football history. Just about every sport I can think of has seen significant improvements in the techniques of those playing and this has generally led to improved performance. If that applies to football then we could reasonably expect to see higher levels of accuracy across time.
Read More

Scoring Shots: Not Just Another Statistic

For a while now I've harboured a suspicion that teams that trail at a quarter's end but that have had more scoring shots than their opponent have a better chance of winning than teams that trail by a similar amount but that have had fewer scoring shots than their opponent. Suspicions that are amenable to trial by data have a Constitutional right to their day in court, so let me take you through the evidence.
Read More

Grand Finals: Points Scoring and Margins

How would you characterise the Grand Finals that you've witnessed? As low-scoring, closely fought games; as high-scoring games with regular blow-out finishes; or as something else?

First let's look at the total points scored in Grand Finals relative to the average points scored per game in the season that immediately preceded them.

GF_PPG.png

Apart from a period spanning about the first 25 years of the competition, during which Grand Finals tended to be lower-scoring affairs than the matches that took place leading up to them, Grand Finals have been about as likely to produce more points than the season average as to produce fewer points.

One way to demonstrate this is to group and summarise the Grand Finals and non-Grand Finals by the decade in which they occurred.

GF_PPG_CHT.png

There's no real justification then, it seems, in characterising them as dour affairs.

That said, there have been a number of Grand Finals that failed to produce more than 150 points between the two sides - 49 overall, but only 3 of the last 30. The most recent of these was the 2005 Grand Final in which Sydney's 8.10 (58) was just good enough to trump the Eagles' 7.12 (54). Low-scoring, sure, but the sort of game for which the cliche "modern-day classic" was coined.

To find the lowest-scoring Grand Final of all time you'd need to wander back to 1927 when Collingwood 2.13 (25) out-yawned Richmond 1.7 (13). Collingwood, with efficiency in mind, got all of its goal-scoring out of the way by the main break, kicking 2.6 (20) in the first half. Richmond, instead, left something in the tank, going into the main break at 0.4 (4) before unleashing a devastating but ultimately unsuccessful 1.3 (9) scoring flurry in the second half.

That's 23 scoring shots combined, only 3 of them goals, comprising 12 scoring shots in the first half and 11 in the second. You could see that many in an under 10s soccer game most weekends.

Forty-five years later, in 1972, Carlton and Richmond produced the highest-scoring Grand Final so far. In that game, Carlton 28.9 (177) held off a fast-finishing Richmond 22.18 (150), with Richmond kicking 7.3 (45) to Carlton's 3.0 (18) in the final term.

Just a few weeks earlier these same teams had played out an 8.13 (63) to 8.13 (63) draw in their Semi Final. In the replay Richmond prevailed 15.20 (110) to Carlton's 9.15 (69) meaning that, combined, the two Semi Finals they played generated 22 points fewer than did the Grand Final.

From total points we turn to victory margins.

Here too, again save for a period spanning about the first 35 years of the competition during which GFs tended to be closer fought than the average games that had gone before them, Grand Finals have been about as likely to be won by a margin smaller than the season average as to be won by a greater margin.

GF_MPG.png

Of the 10 most recent Grand Finals, 5 have produced margins smaller than the season average and 5 have produced greater margins.

Perhaps a better view of the history of Grand Final margins is produced by looking at the actual margins rather than the margins relative to the season average. This next table looks at the actual margins of victory in Grand Finals summarised by decade.

GF_MOV.png

One feature of this table is the scarcity of close finishes in Grand Finals of the 1980s, 1990s and 2000s. Only 4 of these Grand Finals have produced a victory margin of less than 3 goals. In fact, 19 of the 29 Grand Finals have been won by 5 goals or more.

An interesting way to put this period of generally one-sided Grand Finals into historical perspective is provided by this, the final graphic for today.

GF_MOV_PC.png

They just don't make close Grand Finals like they used to.

Game Cadence

If you were to consider each quarter of football as a separate contest, what pattern of wins and losses do you think has been most common? Would it be where one team wins all 4 quarters and the other therefore losses all 4? Instead, might it be where teams alternated, winning one and losing the next, or vice versa? Or would it be something else entirely?

The answer, it turns out, depends on the period of history over which you ask the question. Here's the data:

Game Cadence.png

So, if you consider the entire expanse of VFL/AFL history, the egalitarian "WLWL / LWLW" cadence has been most common, occurring in over 18% of all games. The next most common cadence, coming in at just under 15% is "WWWW / LLLL" - the Clean Sweep, if you will. The next four most common cadences all have one team winning 3 quarters and the other winning the remaining quarter, each of which such cadences have occurred about 10-12% of the time. The other patterns have occurred with frequencies as shown under the 1897 to 2009 columns, and taper off to the rarest of all combinations in which 3 quarters were drawn and the other - the third quarter as it happens - was won by one team and so lost by the other. This game took place in Round 13 of 1901 and involved Fitzroy and Collingwood.

If, instead, you were only to consider more recent seasons excluding the current one, say from 1980 to 2008, you'd find that the most common cadence has been the Clean Sweep on about 18%, with the "WLLL / "LWWW" cadence in second on a little over 12%. Four other cadences then follow in the 10-11.5% range, three of them involving one team winning 3 of the 4 quarters and the other the "WLWL / LWLW" cadence.

In short it seems that teams have tended to dominate contests more in the 1980 to 2008 period than had been the case historically.

(It's interesting to note that, amongst those games where the quarters are split 2 each, "WLWL / LWLW" is more common than either of the two other possible cadences, especially across the entire history of footy.)

Turning next to the current season, we find that the Clean Sweep has been the most common cadence, but is only a little ahead of 5 other cadences, 3 of these involving a 3-1 split of quarters and 2 of them involving a 2-2 split.

So, 2009 looks more like the period 1980 to 2008 than it does the period 1897 to 2009.

What about the evidence for within-game momentum in the quarter-to-quarter cadence? In other words, are teams who've won the previous quarter more or less likely to win the next?

Once again, the answer depends on your timeframe.

Across the period 1897 to 2009 (and ignoring games where one of the two relevant quarters was drawn):

  • teams that have won the 1st quarter have also won the 2nd quarter about 46% of the time
  • teams that have won the 2nd quarter have also won the 3rd quarter about 48% of the time
  • teams that have won the 3rd quarter have also won the 4th quarter just under 50% of the time.

So, across the entire history of football, there's been, if anything, an anti-momentum effect, since teams that win one quarter have been a little less likely to win the next.

Inspecting the record for more recent times, however, consistent with our earlier conclusion about the greater tendency for teams to dominate matches, we find that, for the periods 1980 to 2008 (and, in brackets, for 2009):

  • teams that have won the 1st quarter have also won the 2nd quarter about 52% of the time a little less in 2009)
  • teams that have won the 2nd quarter have also won the 3rd quarter about 55% of the time (a little more in 2009)
  • teams that have won the 3rd quarter have also won the 4th quarter just under 55% of the time (but only 46% for 2009).

In more recent history then, there is evidence of within-game momentum.

All of which would lead you to believe that winning the 1st quarter should be particularly important, since it gets the momentum moving in the right direction right from the start. And, indeed, this season that has been the case, as teams that have won matches have also won the 1st quarter in 71% of those games, the greatest proportion of any quarter.

The Decline of the Humble Behind

Last year, you might recall, a spate of deliberately rushed behinds prompted the AFL to review and ultimately change the laws relating to this form of scoring.

Has the change led to a reduction in the number of behinds recorded in each game? The evidence is fairly strong:

Goals and Behinds.png

So far this season we've seen 22.3 behinds per game, which is 2.6 per game fewer than we saw in 2008 and puts us on track to record the lowest number of average behinds per game since 1915. Back then though goals came as much more of a surprise, so a spectator at an average game in 1915 could expect to witness only 16 goals to go along with the 22 behinds. Happy days.

This year's behind decline continues a trend during which the number of behinds per game has dropped from a high of 27.3 per game in 1991 to its current level, a full 5 behinds fewer, interrupted only by occasional upticks such as the 25.1 behinds per game recorded in 2007 and the 24.9 recorded in 2008.

While behind numbers have been falling recently, goals per game have also trended down - from 29.6 in 1991, to this season's current average of 26.8. Still, AFL followers can expect to witness more goals than behinds in most games they watch. This wasn't always the case. Not until the season of 1969 had there been a single season with more goals than behinds, and not until 1976 did such an outcome became a regular occurrence. In only one season since then, 1981, have fans endured more behinds than goals across the entire season.

On a game-by-game basis, 90 of 128 games this season, or a smidge over 70%, have produced more goals than behinds. Four more games have produced an equal number of each.

As a logical consequence of all these trends, behinds have had a significantly smaller impact on the result of games, as evidenced by the chart below which shows the percentage of scoring attributable to behinds falling from above 20% in the very early seasons to around 15% across the period 1930 to 1980, to this season's 12.2%, the second-lowest percentage of all time, surpassed only by the 11.9% of season 2000.

Behinds PC.png

(There are more statistical analyses of the AFL on MAFL Online's sister site at MAFL Stats.)

Are Footy HAMs Normal?

Okay, this is probably going to be a long blog so you might want to make yourself comfortable.

For some time now I've been wondering about the statistical properties of the Handicap-Adjusted Margin (HAM). Does it, for example, follow a normal distribution with zero mean?

Well firstly we need to deal with the definition of the term HAM, for which there is - at least - two logical definitions.

The first definition, which is the one I usually use, is calculated from the Home Team perspective and is Home Team Score - Away Team Score + Home Team's Handicap (where the Handicap is negative if the Home Team is giving start and positive otherwise). Let's call this Home HAM.

As an example, if the Home Team wins 112 to 80 and was giving 20.5 points start, then Home HAM is 112-80-20.5 = +11.5 points, meaning that the Home Team won by 11.5 points on handicap.

The other approach defines HAM in terms of the Favourite Team and is Favourite Team Score - Underdog Team Score + Favourite Team's Handicap (where the Handicap is always negative as, by definition the Favourite Team is giving start). Let's call this Favourite HAM.

So, if the Favourite Team wins 82 to 75 and was giving 15.5 points start, then Favourite HAM is 82-75-15.5 = -7.5 points, meaning that the Favourite Team lost by 7.5 points on handicap.

Home HAM will be the same as Favourite HAM if the Home Team is Favourite. Otherwise Home HAM and Favourite HAM will have opposite signs.

There is one other definitional detail we need to deal with and that is which handicap to use. Each week a number of betting shops publish line markets and they often differ in the starts and the prices offered for each team. For this blog I'm going to use TAB Sportsbet's handicap markets.

TAB Sportsbet Handicap markets work by offering even money odds (less the vigorish) on both teams, with one team receiving start and the other offering that same start. The only exception to this is when the teams are fairly evenly matched in which case the start is fixed at 6.5 points and the prices varied away from even money as required. So, for example, we might see Essendon +6.5 points against Carlton but priced at $1.70 reflecting the fact that 6.5 points makes Essendon in the bookie's opinion more likely to win on handicap than to lose. Games such as this are problematic for the current analysis because the 'true' handicap is not 6.5 points but is instead something less than 6.5 points. Including these games would bias the analysis - and adjusting the start is too complex - so we'll exclude them.

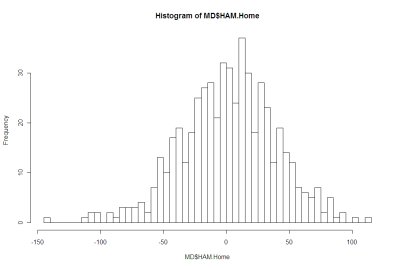
So, the question now becomes is HAM Home, defined as above and using the TAB Sportsbet handicap and excluding games with 6.5 points start or fewer, normally distributed with zero mean? Similarly, is HAM Favourite so distributed?

We should expect HAM Home and HAM Favourite to have zero means because, if they don't it suggests that the Sportsbet bookie has a bias towards or against Home teams of Favourites. And, as we know, in gambling, bias is often financially exploitable.

There's no particular reason to believe that HAM Home and HAM Favourite should follow a normal distribution, however, apart from the startling ubiquity of that distribution across a range of phenomena.

Consider first the issue of zero means.

The following table provides information about Home HAMs for seasons 2006 to 2008 combined, for season 2009, and for seasons 2006 to 2009. I've isolated this season because, as we'll see, it's been a slightly unusual season for handicap betting.

Home_HAM.png

Each row of this table aggregates the results for different ranges of Home Team handicaps. The first row looks at those games where the Home Team was offering start of 30.5 points or more. In these games, of which there were 53 across seasons 2006 to 2008, the average Home HAM was 1.1 and the standard deviation of the Home HAMs was 39.7. In season 2009 there have been 17 such games for which the average Home HAM has been 14.7 and the standard deviation of the Home HAMs has been 29.1.

The asterisk next to the 14.7 average denotes that this average is statistically significantly different from zero at the 10% level (using a two-tailed test). Looking at other rows you'll see there are a handful more asterisks, most notably two against the 12.5 to 17.5 points row for season 2009 denoting that the average Home HAM of 32.0 is significant at the 5% level (though it is based on only 8 games).

At the foot of the table you can see that the overall average Home HAM across seasons 2006 to 2008 was, as we expected approximately zero. Casting an eye down the column of standard deviations for these same seasons suggests that these are broadly independent of the Home Team handicap, though there is some weak evidence that larger absolute starts are associated with slightly larger standard deviations.

For season 2009, the story's a little different. The overall average is +8.4 points which, the asterisks tell us, is statistically significantly different from zero at the 5% level. The standard deviations are much smaller and, if anything, larger absolute margins seem to be associated with smaller standard deviations.

Combining all the seasons, the aberrations of 2009 are mostly washed out and we find an average Home HAM of just +1.6 points.

Next, consider Favourite HAMs, the data for which appears below:

Favourite_HAM.png

The first thing to note about this table is the fact that none of the Favourite HAMs are significantly different from zero.

Overall, across seasons 2006 to 2008 the average Favourite HAM is just 0.1 point; in 2009 it's just -3.7 points.

In general there appears to be no systematic relationship between the start given by favourites and the standard deviation of the resulting Favourite HAMs.

Summarising:

  • Across seasons 2006 to 2009, Home HAMs and Favourite HAMs average around zero, as we hoped
  • With a few notable exceptions, mainly for Home HAMs in 2009, the average is also around zero if we condition on either the handicap given by the Home Team (looking at Home HAMs) or that given by the Favourite Team (looking at Favourite HAMs).

Okay then, are Home HAMs and Favourite HAMs normally distributed?

Here's a histogram of Home HAMs:

Home_HAM_Pic.png

And here's a histogram of Favourite HAMs:

Favourite_HAM_Pic.png

There's nothing in either of those that argues strongly for the negative.

More formally, Shapiro-Wilks tests fail to reject the null hypothesis that both distributions are Normal.

Using this fact, I've drawn up a couple of tables that compare the observed frequency of various results with what we'd expect if the generating distributions were Normal.

Here's the one for Home HAMs:

Home_HAM_Table.png

There is a slight over-prediction of negative Home HAMs and a corresponding under-prediction of positive Home HAMs but, overall, the fit is good and the appropriate Chi-Squared test of Goodness of Fit is passed.

And, lastly, here's the one for Home Favourites:

Favourite_HAM_Table.png

In this case the fit is even better.

We conclude then that it seems reasonable to treat Home HAMs as being normally distributed with zero mean and a standard deviation of 37.7 points and to treat Favourite HAMs as being normally distributed with zero mean and, curiously, the same standard deviation. I should point out for any lurking pedant that I realise neither Home HAMs nor Favourite HAMs can strictly follow a normal distribution since Home HAMs and Favourite HAMs take on only discrete values. The issue really is: practically, how good is the approximation?

This conclusion of normality has important implications for detecting possible imbalances between the line and head-to-head markets for the same game. But, for now, enough.

Pointless v St Kilda

The Swans' 2nd and 3rd quarter performances last Saturday should not go unremarked.

In the 3rd quarter they failed to register a point, which is a phenomenon that's occurred in only 1.2% of all quarters ever played and in just 0.3% of quarters played since and including the 1980 season. Indeed, so rare is it that only one occurrence has been recorded in each of the last two seasons.

Last year, Melbourne racked up the season's duck egg in the 1st quarter of their Round 19 clash against Geelong, leaving them trailing 0.0 to 8.5 at the first change and in so doing setting a new standard for rapidity in disillusioning Heritage Fund Investors. In 2007 the Western Bulldogs were the team who failed to trouble the goal umpire for an entire quarter - the 2nd quarter of their Round 22 game against the Kangaroos.

So, let's firstly salute the rarity that is failing to score for an entire quarter.

But the Swans did more than this. They preceded their scoreless quarter with a quarter in which they kicked just two behinds. Stringing together successive quarters that, combined, yield two points or fewer is a feat that's been achieved only 175 times in the entire history of the game, and 140 of those were recorded in the period from 1897 to 1918.

Across the last 30 seasons only 12 teams have managed such frugality in front of goal. Prior to the Swans, the most recent example was back in Round 14 of 2002 when West Coast went in at half-time against Geelong having scored 4.7 and headed to the sheds a bit over an hour later having scored just two behinds in the 3rd quarter and nothing at all in the 4th. That makes it almost 6-and-a-half seasons since anyone has done what the Swans did on Saturday.

Prior to the Eagles we need to reach back to Round 4 of 1999 when Essendon - playing West Coast as it happens - finished the 1st quarter and the half stuck at 2.2 and then managed just two behinds in the 3rd term. (They went on to record only two more scoring shots in the final term but rather spoiled things by making one of them a major.)

If you saw the Swans games then, you witnessed a little piece of history.

Marginally Interesting

Here are a handful of facts on AFL margins:

  • The largest ever victory margin was 190 points (Fitzroy over Melbourne in 1979)
  • Every margin between 0 and 150 points has been achieved at least once except margins of 136, 144, 145, 148 and 149 points.
  • Last season, no game finished with a victory margin of 25 points
  • No game finished with a margin of 47 points in the previous 2 seasons
  • No game finished with a margin of 67 points in the previous 5 seasons
  • No game finished with a margin of 90, 94 or 98 points in the previous 8 seasons
  • No game finished with a margin of 109 points in the previous 12 seasons
  • No game finished with a margin of 120 points in the previous 17 seasons
  • No game finished with a margin of 128 points in the previous 39 seasons
  • No game finished with a margin of 161 points in the previous 109 seasons
  • At least one game has finished with a margin of 6 points in each of the previous 48 seasons
  • At least one game has finished with a margin of 26 points in each of the previous 42 seasons

Percentage of Points Scored in a Game

We statisticians spend a lot of our lives dealing with the bell-shaped statistical distribution known as the Normal or Gaussian distribution. It describes a variety of phenomena in areas as diverse as physics, biology, psychology and economics and is quite frankly the 'go-to' distribution for many statistical purposes.

So, it's nice to finally find a footy phenomenon that looks Normally distributed.

The statistic is the percentage of points scored by each team is a game and the distribution of this statistic is shown for the periods 1897 to 2008 and 1980 to 2008 in the diagram below.

Percent_of_Points_Scored.png

Both distributions follow a Normal distribution quite well except in two regards:

  1. They fall off to zero in the "tails" faster than they should. In other words, there are fewer games with extreme results such as Team A scoring 95% of the points and Team B only 5% than would be the case if the distribution were strictly normal.
  2. There's a "spike" around 50% (ie for very close and drawn games) suggesting that, when games are close, the respective teams play in such a way as to preserve the narrowness of the margin - protecting a lead rather than trying to score more points when narrowly in front and going all out for points when narrowly behind.

Knowledge of this fact is unlikely to make you wealthy but it does tell us that we should expect approximately:

  • About 1 game in 3 to finish with one team scoring about 55% or more of the points in the game
  • About 1 game in 4 to finish with one team scoring about 58% or more of the points in the game
  • About 1 game in 10 to finish with one team scoring about 65% or more of the points in the game
  • About 1 game in 20 to finish with one team scoring about 70% or more of the points in the game
  • About 1 game in 100 to finish with one team scoring about 78% or more of the points in the game
  • About 1 game in 1,000 to finish with one team scoring about 90% or more of the points in the game

The most recent occurrence of a team scoring about 90% of the points in a game was back in Round 15 of 1989 when Essendon 25.10 (160) defeated West Coast 1.12 (18).

We're overdue for another game with this sort of lopsided result.

Which Quarter Do Winners Win?

Today we'll revisit yet another chestnut and we'll analyse a completely new statistic.

First, the chestnut: which quarter do winning teams win most often? You might recall that for the previous four seasons the answer has been the 3rd quarter, although it was a very close run thing last season, when the results for the 3rd and 4th quarters were nearly identical.

How then does the picture look if we go back across the entire history of the VFL/AFL?

Qtrs_Won_By_Winners.png

It turns out that the most recent epoch, spanning the seasons 1993 to 2008, has been one in which winning teams have tended to win more 3rd quarters than any other quarter. In fact, it was the quarter won most often in nine of those 16 seasons.

This, however, has not at all been the norm. In four of the other six epochs it has been the 4th quarter that winning teams have tended to win most often. In the other three epochs the 4th quarter has been the second most commonly won quarter.

But, the 3rd quarter has rarely been far behind the 4th, and its resurgence in the most recent epoch has left it narrowly in second place in the all-time statistics.

A couple of other points are worth making about the table above. Firstly, it's interesting to note how significantly more frequently winning teams are winning the 1st quarter than they have tended to in epochs past. Successful teams nowadays must perform from the first bounce.

Secondly, there's a clear trend over the past 4 epochs for winning teams to win a larger proportion of all quarters, from about 66% in the 1945 to 1960 epoch to almost 71% in the 1993 to 2008 epoch.

Now on to something a little different. While I was conducted the previous analysis, I got to wondering if there'd ever been a team that had won a match in which in had scored more points than its opponent in just a solitary quarter. Incredibly, I found that it's a far more common occurrence than I'd have estimated.

Number_Of_Qtrs_Won_By_Winners.png

The red line shows, for every season, the percentage of games in which the winner won just a solitary quarter (they might or might not have drawn any of the others). The average percentage across all 112 seasons is 3.8%. There were five such games last season, in four of which the winner didn't even manage to draw any of the other three quarters. One of these games was the Round 19 clash between Sydney and Fremantle in which Sydney lost the 1st, 2nd and 4th quarters but still got home by 2 points on the strength of a 6.2 to 2.5 3rd term.

You can also see from the chart the upward trend since about the mid 1930s in the percentage of games in which the winner wins all four quarters, which is consistent with the general rise, albeit much less steadily, in average victory margins over that same period that we saw in an earlier blog.

To finish, here's the same data from the chart above summarised by epoch:

Number_Of_Qtrs_Won_By_Winners_Table.png

Winners' Share of Scoring

You might recall from seasons past my commenting on what I've claimed to be a startling regularity in AFL scoring, specifically, the proportion of scoring shots recorded by winning teams.

In 2008, winning teams racked up 57.3% of all scoring shots, while in 2007 the figure was 56.6%, and in 2006 it was 56.7%. Across the period 1999 to 2008 this percentage bounced around in a range between 56.4% and 57.8%. By any standard that's remarkable regularity.

I've recently come into possession of the scores for the entire history of the VFL/AFL competition in a readily analysable form - and by now you surely now how dangerous that's gotta be - so it seemed only natural to see if this regularity persisted into earlier seasons (assuming that it makes sense for something to persist into the past).

Below is a chart showing (in purple) the percentage of scoring shots registered by winning teams in each of the seasons 1897 through 2008. (The red line shows the proportion of goals that they scored, and the green line shows the proportion of behinds.)

Winners_Scoring.png

So, apart from the more extreme dominance of winning teams in the first decade or so of the competition, and a few other aberrant seasons over the next two decades, we have certainly seen remarkable stability in the percentage we've been discussing. Indeed, in the period 1927 to 2008, the percentage of scoring shots registered by winning teams has never been outside the range 55.0% to 59.6%. That surely almost establishes this phenomenon as a Law of Footy.

For those of you who prefer to digest your data in tabular form (preferably taken with meals), here's a decade-by-decade summary of the data.

Winners_Scoring_Table.png

The recent peak in winning teams' share of scoring was witnessed in 1995 and it came not as a consequence of a spike in 6-pointer dominance but instead from a spike in winning teams' share of behinds. In 1995 winning teams scored 57% of all behinds, which is about 2-4% higher than anything we've witnessed since. 1995 was the year that Carlton won the minor premiership kicking 317 behinds, Geelong finished runners-up kicking 338, and Richmond and Essendon, finishing in 3rd and 4th, kicked 600 more between them. By way of context, that's almost 75 more behinds than the top 4 of Geelong, Hawthorn, Western Bulldogs and St Kilda managed in 2008.

Regularity also aptly describes the history of the percentage of goals kicked by winning teams across the seasons (the red line in the chart). Again looking at the entire period since 1927, this percentage has never strayed from the righteous range of 57.0% to 61.8%.

Winning teams' share of behinds (the green line) has been, relatively speaking, quite variable, ranging from 51.9% to 58.2% in the period 1927 to the present, which once again demonstrates that it's goals and not behinds that win footy games.

A Little AFL/VFL History

Every so often this year I'll be diving into the history of the VFL/AFL to come up with obscure and conversation-stopping facts for you to use at the next social event you attend.

For example, do you know the most common score in AFL history? It's 12.12 (84) and has been a team's final score about 0.88% of the time (counting two scores for each game in the denominator for that percentage). What if we restrict our attention to more recent seasons, say 1980 to 2008? It's 12.12 again (84), only now its prevalence is 0.98%. Last year though we managed only a single 12.12 (84) score, courtesy of St Kilda in Round 14.

While we're on the topic of scores, which season do you think produced the highest average score per team? It was 1982 and the average was 112.07 points. The trend since that season has been steadily downwards with the nadir being in 1997 when the average was 90.37 points.

Average_Team_Scores.png

From season averages to individual game scores, here are a couple of doozies. In May of 1919, Geelong took on St Kilda in a Round 5 clash at Corio Oval. The first quarter failed to produce a goal from either team and saw Geelong lead 0.6 to 0.2. St Kilda found their range - relatively speaking - in the second quarter to lead 3.4 to 0.9 at the main break. One need speculate only briefly about the thrust of the Cats' half-time speech from the coach.

The speech clearly didn't help, however, as Geelong continued to accumulate only singles for the remaining two quarters, finally emerging goal-less and defeated, 0.18 to 6.10.

Just over two years later, in July of 1921, St Kilda swapped roles and matched the Cats' ineptitude, eventually going down 0.18 to Fitzroy's 6.8 in front of around 6,000 startled fans.

If you're looking for more sustained inaccuracy you'd be after the South Melbourne team of 1900. They managed 59.127 for the entire season, a 31.7% accuracy rate.

In contrast, in 1949 the Hawks put on a spectacular display of straight kicking at Glenferrie Oval, finishing with 7.0 for the game. Regretably, their opponents, Essendon, clearly with no sense of aesthetics, repeatedly sprayed the ball at goal finishing 70 point victors by bagging a woefully inaccurate 16.16.

Again, turning from the single game to an entire season, plaudits must go to the St Kilda team of 2004, who registered 409.253 or 61.8% for the season. But, as the Hawks discovered, accuracy does not preordain success: St Kilda went out in the Preliminary Final to Port by 6 points.