Upsets and Mismatches in VFL/AFL Finals: 1897 to 2013
/Port Adelaide's victory over Collingwood last weekend was, I discovered last night, the greatest upset in a Final in VFL/AFL history.
That's the conclusion you'd come to if you believed my All-Time MARS Ratings (now calculated based on assuming that the higher Rated team is the home team in any Final) and if you agreed that the appropriate metric with which to measure the unlikeliness of a result - that is, how much of an 'upset' it was - is the difference in the winner's and loser's pre-game MARS Ratings.
Using that approach to make the assessment, here are the 25 Greatest Upsets in VFL/AFL Finals history.

The top three upsets all come from the current century, which might at least partly be attributed to longer seasons that allow for a greater degree of Ratings differentiation amongst the teams. Subtle differences in class have more opportunity to show themselves in a longer season.
Seventh on the list is St Kilda's 83-79 triumph over the Cats in 2010, which was the first game in a sequence that propelled the Saints into a drawn Grand Final and an ultimate loss in the Grand Final Replay. That drawn Grand Final is also shown in the Top 25 here since the Pies failed to win despite holding a 26.4 Ratings Point (RP) superiority over the Saints.
One other game that might be recollected by MAFL readers is Fremantle's victory over the Cats, not last weekend, but in the equivalent round of the Finals last year. In that game the Dockers won despite the Cats enjoying an almost 23 RP advantage.
Since we're looking at extremes in Finals, let's next review the 25 Greatest VFL/AFL Finals Mismatches, where we measure the extent of the mismatch based on the difference in the teams' pre-game MARS Ratings.
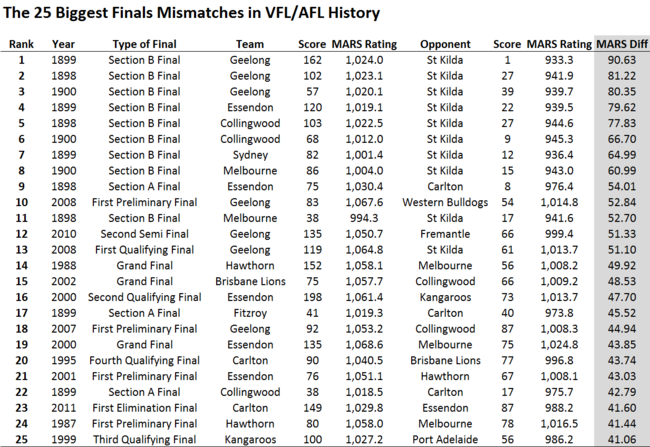
Note that in none of these games did the lower Rated team prevail, although they went desperately close in a few. The top of the list is littered with Finals from the earliest VFL seasons, for which period the designation of "Final" is somewhat subjective.
It's not until we reach the game listed tenth that we find an unarguable Finals contest that was clearly a mismatch. That was the 2010 Preliminary-Final, pitting a 1,068 Rated Cats against a 1,015 Rated Dogs, which ended with a predictably comfortable victory for the Cats.
(By the way, in this list, and in all other lists in this blog, I've used the modern, post-merger names of all teams. So, for example, South Melbourne appear as Sydney, and North Melbourne as the Kangaroos throughout.)
Surprisingly, three Grand Finals make the list: the 1988 Hawthorn v Melbourne game (won by almost 100 points by the much more highly Rated Hawks), the 2002 Lions v Pies contest (won by just 9 points by the higher Rated Lions), and the 2000 Essendon v Melbourne GF (won by the higher Rated Dons by a margin of 10 goals).
Note that, once we get past the debatable Finals at the head of the list, we again see a predominance of contests from more recent, and hence lengthier, seasons.
Consider next the quality of a Final, which we'll assess on the basis of the aggregate MARS Ratings of the participants.
Firstly, let's look at the 25 Finals with the lowest MARS Rating aggregates - the "Weakest Finals", as I've dubbed them.

Here too the top of the list is dominated by Finals, as I've defined them, from before 1900.
The first game to appear from more modern eras is the 1976 Elimination Final that saw the Cats take on the Dogs, both Rated below 1,000. In that game the Cats prevailed by 7 points only to lose by over 5 goals to North Melbourne in the following week.
Next on the list, in 15th, is an even-more recent game. It's the 2000 Hawks v Cats Elimination Final, won by a 1,002 Rated Hawks by 9 points over a 991 Rated Cats. The Hawks also lasted only one more week in the Finals, going down to the Roos the following weekend.
The most modern game of all on the list is the 2005 Cats v Dees Elimination Final. It was won easily by the 1,013 Rated Cats who, despite their higher Rating, still went out the next week, losing in the Semi-Final to the Swans 53-56.
Lastly, and to end on a positive note, consider the 25 Finals with the highest aggregate team Ratings.

Here too, longer seasons seem to have favoured entry to the list. The highest aggregate was recorded by the 2011 Grand Finalists, the Pies and the Cats, who between them had accumulated almost 2,119 RPs.
Over half the games on this list are, as you might expect, Grand Finals, and in no game is there a team Rated under 1,033. What is a little surprising is how well the weaker teams in these contests have fared: in total they've won 13 of the 25 games shown here, including 4 of the top 6.
To finish, just a few comments about the frequency with which different teams appear on these lists:
- Collingwood - who, as we know, have had a particularly painful record in Grand Finals - dominate the wrong side of the 25 Greatest Finals Upsets list. They appear 7 times. Next most-common is Geelong with 5 appearances.
- The right-hand side of that List - the "upsetters", if you like - sees 5 Richmond and 4 Fitzroy appearances.
- Geelong (7) and Essendon (5) make most appearances in Finals Mismatches as the stronger teams, while St Kilda (10), Carlton (3) and Melbourne (3) make most appearances as the weaker team.
- St Kilda (9 - all as the weaker team), Geelong (8 - 5 as the stronger and 3 as the weaker), and Melbourne (6 - 4 as the stronger and 3 as the weaker), are the teams making most appearances in The 25 Weakest Finals.
- Hawthorn (16 - 10 as the stronger and 6 as the weaker), Geelong (7 - 4 as the stronger and 3 as the weaker), Essendon (6 - 4 as the stronger and 2 as the weaker), and Carlton (6 - 1 as the stronger and 5 as the weaker), are the teams making most appearances in The 25 Strongest Finals.
