Is Class More or Less Important In AFL Finals?
/You'll hear it said about sport that class emerges when it's needed most. If that applies to football then you'd expect that better teams would be more likely to win games in the Finals than they are games in the regular home-and-away season.
The question for today is: empirically, are they more likely?
DATA AND APPROACH
For this blog I'll be considering the entire history of VFL/AFL football, split into eras, mostly of about 15 seasons each, differentiating within each era those games from the regular home-and-away seasons from those designated Finals. The score and result data - the target variables for the models - will be the actual final game scores (what else?), and the regressors will be my historical team MARS Ratings.
Usually, in creating models for MAFL, I parameterise them to reflect the distinction between the home team and the away team in such a way that the home ground advantage is bound up in some or all of the model coefficients. For this blog I'm instead going to parameterise the models to distinguish between the Stronger (ie higher MARS Rated) and the Weaker (ie lower MARS Rated) team, and include a 1/0 variable to reflect whether or not the Stronger team was also the home team.
Further, in the Finals, where home ground status is often moot, I'm going to define the Home team as being the Stronger team. This definition is different from that I've used previously to create historical MARS Ratings and does have an effect on those Ratings since the Rating algorithm takes account of which team is at home and which is away when calculating the teams' Ratings adjustments. Those effects, however, are small. (I discovered while preparing this blog that my data currently assumes that, for most Finals, the winning team was the home team, which seems to me a little after the factish.)
So, with the parameterisation I'm using for this blog, when I'm building bivariate Normal regression models to explain game margins the models will be of the form:
Stronger Team Score = a1 + a2 x Stronger Team MARS Rating + a3 x Weaker Team MARS Rating + a4 x Stronger Team At Home (Y/N)
Weaker Team Score = b1 + b2 x Stronger Team MARS Rating + b3 x Weaker Team MARS Rating + b4 x Stronger Team At Home (Y/N)
Similarly, when I'm building the logistic regression model to explain game results from the point of view of the Stronger team, the models are of the form:
ln(P(Stronger Team Wins)/(1-P(Stronger Team Wins) )) = c1 + c2 x Stronger Team MARS Rating + c3 x Weaker Team MARS Rating + c4 x Stronger Team At Home (Y/N)
(Note that the Stronger Team At Home (Y/N) variable is omitted when modelling the Finals since it always has a value of 1 for these games given how I've defined home team status, and so is collinear with the constant term.)
SUMMARY OF STRONGER TEAM PERFORMANCES
Before diving into the complexity of model-building, let's first take a look at the raw win/loss data for Stronger teams in home-and-away games compared with Finals.

In every era shown in the table, except for the first era from 1897 to 1909, Stronger teams have won less often in Finals than they have in home-and-away games. In the era 1910 to 1924, and 1925 to 1939 Stronger teams performed particularly poorly, in the first of those eras actually winning less often than they lost.
More-recent eras have seen the Finals versus home-and-away season difference in winning rates for Stronger teams diminish but not evaporate.
One obvious reason, you might hypothesise, that Stronger teams win Finals less often than they win home-and-away season games is because they'll probably be facing stronger teams in Finals. That hypothesis is supported by the data, which is summarised in the rightmost columns of the table and which show that, for example, in the most recent era, the average difference in MARS Ratings between the Stronger and Weaker teams in home-and-away contests has been 23.2 Ratings Points (RPs), while in Finals it's been only 17.3 RPs.
The question is then, if we adjust for those differences in team Ratings, do Stronger teams still win at a lower rate in Finals, or is the entirety of the difference in winning rates explained by the difference in the average quality of their opponents?
MODELLING TEAM SCORES
Before modelling game results - which I will do later in this blog - I'm first going to model game margins taken from the viewpoint of the Stronger team.
The results of this modelling are in the table below.

A number of interesting features emerge from this table:
- Generally, the variability in the scoring of Stronger teams is better explained by the models than the variability in the scoring of Weaker teams, as evidenced by the higher R-squared values for the models seeking to explain the Stronger teams' scores
- The models only explain a small proportion of the variability in Stronger team and in Weaker team scores. They are much smaller, in particular, than they were in that similar analysis I did previously. This is perhaps due, at least in part, to my grouping seasons into (not entirely homogenous) eras here as opposed to fitting the results for each season separately, as I did in that earlier blog. With so few Finals in each season, some aggregation of seasons is justified, but less aggregation would almost certainly improve the fit, probably at the expense of masking the broad trends seen here. ANother blog, another time ...
- Despite the higher R-squareds for models of Stronger team scores in comparison to models of Weaker team scores, the residual variance is still higher for Stronger teams than for Weaker teams. The difference (in terms of standard deviation) is about 3-5 points in a typical era, and less for models of Finals than of home and away season games.
- In the two most-recent eras Finals have tended to be more "zero sum" affairs, as evidenced by the negative correlations between the residuals for the two models of the team scores, which imply that when the Stronger team scores more points than we'd expect, the Weaker team scores fewer points than we'd expect, and vice versa.
- The impact of a single additional RP on the expected margin of victory of the Stronger team has varied considerably across the eras. For example, in the 1897 to 1909 era, a single extra RP for the Stronger team was associated with an increase of about 0.8 points in its expected victory margin for home and away games, while a single extra RP for the Weaker team was associated with a decline of about 0.9 points for that same game type. In the 1985 to 1999 era the equivalent figures were +0.5 points and -0.6 points.
- In contrast, the value to the Stronger team in playing at home has varied by only about 1 goal across all eras, from a low of 13.2 points for the 1910 to 1924 era, to a high of 19.3 points for the 1985 to 1999 era.
We can apply these models to the immediate question under consideration by using them to predict the scores for games involving teams of varying MARS Ratings.

In the first block we consider a game where the Stronger team is only very slightly superior to the Weaker team, having a MARS Rating of 1,001 to its opponent's 1,000.
The results on the left of this block provide the fitted values for the case where the Stronger team is playing at home, those on the right for where the Stronger team is playing away (which is impossible in Finals given my method for determining home team status in Finals).
We can see that, controlling for opponent quality - that is, the MARS Rating of the Weaker team - a Stronger team of a fixed MARS Rating (of 1,001) is expected to win by a smaller margin in Finals than in home-and-away contests where it is the home team.
Looking next at the middle block we find that the same is not always true when the Stronger team enjoys a more substantial Ratings advantage, a situation that's far less likely to prevail in Finals.
Finally, looking at the rightmost block, which uses Ratings more in keeping with what we'd expect in an average Final, we again find that in almost every era the Stronger team has been expected to win by a smaller margin in Finals than in home-and-away games where it's the home team.
So, we've an answer to the question posed at the start of this blog. Class, it seems, is worth less in the Finals than it's worth in the home-and-away season.
Why is that? Well, for the modern era at least, the table above suggests that it might be because Finals are coached and played differently, specifically in a manner that allows a weaker team to reduce the scoring ability of the stronger team: the modelled score of the Stronger team in the table above is about 9 points lower in Finals than in home-and-away games (91 v 100). This strategy also comes at a price for the Weaker team, its expected score falling by 3 points from 84 to 81, but the net reduction in the expected margin is equivalent to a net increase in the Weaker team's probability of victory.
MODELLING GAME RESULTS
A more direct approach to goal would be to fit game results rather than game margins, and that's what I've done for this final table.
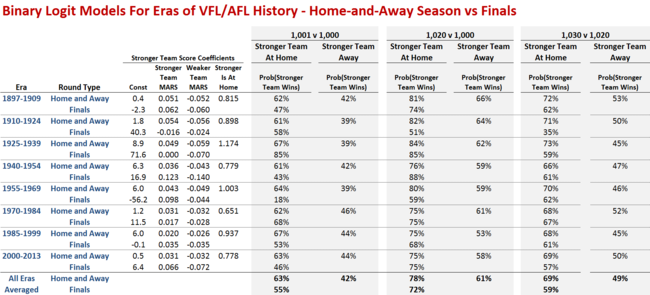
As you might expect, the broad results are very similar.
A marginally superior Stronger team (see the lefthand block) is projected to win at a rate 10-15% points or even more lower in Finals than in home-and-away games. In fact, in the 1955 to 1969 era, the expected winning rate is a spectacularly low 18%.
The rightmost block, which provides the best set of data for a "typical" Final, reveals that, in the modern era, the probability that a 1,030 Rated team beats a 1,020 Rated team is about 10% points lower in Finals than in the home-and-away season.
No wonder the MAFL Funds are cutting back on their wagering over the course of the Finals.
