Bookie v Punter Simulations: An Introduction
/For this series of blogs I've built a simulation of a very different kind. It's not designed to simulate team v team but, instead, is about simulating bookie v punter.
Read MoreAnother week, another 1,000,000 simulations.
This week it's a relatively brief summary, since there are only four teams remaining and because TAB Sportsbet no longer has markets for teams' chances of making the Grand Final nor for the possible Grand Final pairings.
Here's what I have by way of simulation inputs and outputs:
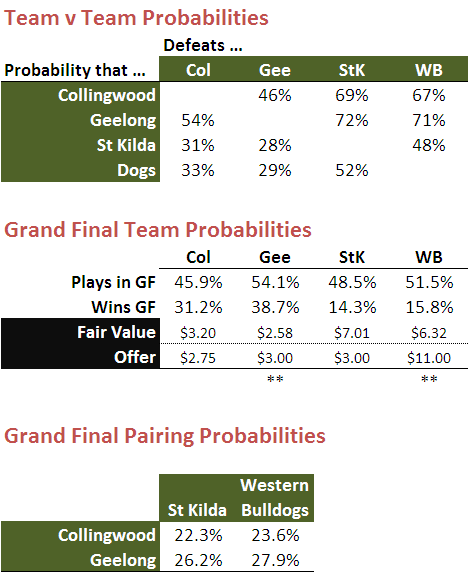
Firstly note that I have the Dogs, who have the higher MARS Rating, as favourites to defeat the Saints. That certainly isn't the way that the TAB Sportsbet bookie is seeing it: in the row labelled "Offer" you can see that he currently has the Saints at $3 for the Flag and the Dogs at $11. Not surprisingly, the simulations suggest the Dogs are very good value at that price - hence the double-asterisk under them.
The Cats too, however, are value in the Flag market, priced as they are at $3. The simulations suggest that anything over about $2.60 represents value for them.
Collingwood, at $2.75, are about $0.45 too short to be attractive, and the Saints, at $3, are way too short to be worthy of a punt.
All four possible Grand Final pairings are near equally likely, with a Cats v Dogs matchup marginally the most likely pairing for the Big One, and a Pies v Saints matchup the least likely.
Okay, six teams left, and you know the drill.
Here's the probability matrix I'm using this week (and again we're ignoring any home ground benefits):

Running the now customary 1,000,000 simulations using this matrix gives us the probabilities shown in the tables below. The rows labelled "Fair" contain fair value prices and those labelled "Offer" contain the most-recent TAB Sportsbet prices.

Double-asterisks denote those wagers that the simulations suggest represent value. As has been the case for a while now, the simulations suggest that the Dogs represent value in both the Flag and the Plays-in-the-GF market.
As well, the Cats are a value bet at $4 for the Flag; the simulations suggest that any price over about $3.30 for them represents value.
In contrast, Sydney and Freo represent appalling value at only $13 and $41 respectively. You'd instead want about $30 and $125 respectively to feel as though you were obtaining fair value for this pair.
Lastly, a look at the GF Quinellas, where you'll notice that only 9 possible Grand Final pairings remain possible:

Here, the value combinations are indicated by green shading, and all of the value bets involve the Dogs.
Whether the Dogs are value bets or not all still comes down to the extent to which you believe that the Dogs' recent performances are the best indicators of their likely performance next week and, if they survive, in the weeks that follow.
I've just run a quick 1 million simulations of the finals using the following probability matrix, which is based on each team's current MARS Rating and assumes that there is no home ground advantage in the finals:

With this matrix and a slab of CPU seconds, I obtain the following probabilities for each team (1) playing in, and (2) winning the Grand Final:

Probabilities shown shaded green are those corresponding to value TAB Sportsbet wagers. Still we find that the TAB bookie is - according to MARS Ratings and my simulations - undervaluing the Dogs. He has them priced at $11 and I estimate them to be about $6.50 chances. That's quite a difference.
I'm also now suggesting that the TAB have the Cats inappropriately rated, so a wager on them at $2.50 represents (slender) value. I rate them value at $2.45 and above.
Finally, a quick look at the GF Quinellas:

Only the Collingwood v Dogs matchup continues to offer value. It's currently priced at $6; I'd be happy to take anything over $5.60.
(I note in passing that the only impossible GF pairings from amongst the eight finalists are Fremantle v Hawthorn and Sydney v Carlton, since these are the Week 1 finals matchups and one team from each of those pairings will be bowing out next weekend.)
Freo's selectorial shenanigans of last weekend appear to have spooked the TAB Sportsbet bookie, so much so that he's not yet posted any of the line markets.
I expect he'll address this oversight sometime in the next 24 hours, in which case I'll post the week's wagering and tipping details tomorrow night.
In the meantime, here's a follow up blog on simulating the finals.
You'll recall from a previous blog that there are eight likely team orderings for the finals. They are the following:

In the earlier blog, I reported how little it mattered for any team's flag chances which of these orderings eventuated - no team's probability varied by more than 0.5% in the simulated results across all eight orderings.
What I didn't report there was how much each team's chances of playing in the Grand Final varied across these eight orderings. So, let's have a look at that.

The cells highlighted in green flag the ordering that maximises a particular team's chances of playing in the Grand Final. So, for example, finishing order A - the current ladder order - maximises Hawthorn's chances of running around in the Granny. Cells highlighted in red represent orderings that minimse a team's chances of playing in the Grand Final. St Kilda, for example, would least like ordering B, because it would probably see them play Carlton in Week 2 of the Finals, who are rated 1,009 on MARS.
Though individual team's chances of playing in the Grand Final do not vary by a great deal across the eight most likely orderings, we do see larger differences than we saw for team's flag chances - of the order of 1-2% for teams likely to finish in positions 3 to 8.
For Sydney, Freo, Hawthorn and Carlton - all teams with small absolute chances of winning the flag - differences of this magnitude are quite material. For example, Carlton's chances of winning the flag increase by almost 50% (from 3.6% to 5.3%) as we move from ordering F to ordering H.
In the earlier blog we found that the Dogs represented the only value wager in the flag market. TAB Sportsbet also offer a market for the Grand Final pairing. The following table sheds light on the value in this market. It shows the probability for each of the 28 possible Grand Final pairings, for each of the eight most likely orderings.

At the right of the table the range of fair value prices for each pairing is shown, based on the smallest and largest probability of that pairing occurring across the eight most likely final orderings.
Next to this range I've provided the latest prices on offer from TAB Sportsbet and flagged with a double-asterisk any pairing that represents value according to my simulated results.
As in the flag market, it's wagers involving the Dogs that seem to represent the greatest value in the GF pairings market: Grand Finals that have Geelong, Collingwood or Sydney facing the Dogs all look attractively priced based on current MARS Ratings.
Clearly, the TAB Sportsbet bookie rates the Dogs' chances very differently to MARS. He's significantly rerated the Dogs on the strength of their two most-recent outings. The Dogs have also seen their MARS Rating drop as a consequence of these two poor showings - by over 11.5 Ratings Points - but still lay claim to an impressive 1,031 MARS Rating.
It all comes down to how much weight you place on recent performance versus season-long pedigree.
The teams that will comprise the final 8 are now determined - barring Lazarian performances - but their final order is not.
Here's what the latest simulations show about each team's likely ladder finish:

With no real interest in who'll make the eight, I wondered instead how much it matters if, say, Sydney finishes 7th rather than 5th?
To answer this question I needed a probability matrix showing, for example possible pairing of teams in the 8, the probability of victory for each team. To create this matrix I used the current MARS Ratings for each team and the following equation:
Probability of Victory = exp((0.712*(Own MARS Rating - Opponent's MARS Rating))/22.3) / (1+exp((0.712*(Own MARS Rating - Opponent's MARS Rating))/22.3))
This equation is based on equations I derived in earlier blogs and, importantly, assumes that there is no home ground advantage in the finals. It provides this probability matrix:

In the 100,000 simulations used to create the first chart there were only eight relatively likely finishing orders for the top 8 teams. For the next round of simulations I played out the 4 weeks of the finals 100,000 times for each of these eight finishing orders and recorded which team won the Grand Final in each simulation.
The results of this are summarised in the table below. As you move down the rows the relative likelihood of that particular set of ladder positions shrinks, from about 27% for the top row (which, as well as being the most likely finishing order is also the current order) to about 1% for the bottom row.

What's startling about this table is how little variability there is across the rows - these simulation results suggest that, this season, a team's finishing order will have very little impact on its absolute prospects of winning the flag.
Roughly speaking, Geelong are about a 39% chance of winning the flag, Collingwood are at about 31%, St Kilda's about 11%, the Dogs about 15%, and the rest are all around 0.5-1.5% each.
The lack of variability between the rows, I'd suggest, is largely because positions 1 to 4 are already determined - so there's no source of variability there - and because the teams in positions 5 to 8, based on their relative MARS Ratings, have little chance of toppling the teams above them. None of the teams in positions 5 to 8 has a probability greater than 38% of defeating a team from the top 4 even once, so doing it two or three times - which is what they'll need to do to win the flag - seems very unlikely.
If you believe these simulations, then the fair value prices are as follows (the current TAB Sportsbet prices are in brackets and any value bets are in bold):
So, only the Dogs at $9 offer any value.
As I type this late on Sunday evening all ladder-related markets are suspended on TAB Sportsbet, so I'll necessarily be excluding any discussion of value bets in these markets. I'll post subsequently on this once the markets are up.
In the meantime, here's what my simulations now make of each team's chances.
Minor Premiership Market
As conclusions go, this one's now about as foregone as you can get.
Simulations suggest that the Pies' chances for the minor premiership are now greater than 98%, up about 0.7% on last week, making their fair-value price $1.02.
The Cats remain the only other team with any hope of the minor premiership, and their fair- value price is now over $63.
Top 4 Market
Geelong and St Kilda joined Collingwood this week as the teams with assured Top 4 spots, leaving the Bulldogs and Freo to duel for the remaining spot.
In reality though Fremantle having only the slightest chance to grab 4th since to do so, given their inferior percentage, they'd probably need to beat both Hawthorn and Carlton, and hope the Dogs lost to Sydney and Essendon. This scenario has a probability of less than 1% according to the simulations.
Fair-value prices for the Dogs and Fremantle are $1.01 and $117 respectively.
Finals Market
Carlton and Sydney this week cemented their finals berths and Hawthorn just about did the same. The Hawks are now 92% chances, making their fair-value price $1.09.
The Roos' loss to the Saints lopped over 20% from their finals chances, leaving them with a probability of just under 6% of playing in 3 weeks time. Melbourne also ran a scythe through their finals aspirations in going down to the Hawks and now sport only a 2% chance of playing in September.
Fair-value for the Roos in this market is now $17.30 and for the Dees it's $51.20.
The Spoon Market
As the Pies have one hand on the minor premiership, so the Eagles have a mortgage on the Spoon. They're now 99% chances to take home the cutlery.
Both the Lions and Richmond have mathematical chances to grab the Spoon for themselves, but those chances both start with a zero before the decimal point.
Fair-value for the Eagles is $1.01, for Richmond it's $150, and for the Lions it's $603.
Here are the full results of the new simulations.

With just two rounds to go, the range of possible ladder finishes for each team has narrowed dramatically, as you can see from the table below.

Most teams now have realistic chances of finishing in one of two or three spots. Only Carlton, Melbourne and Port Adelaide have four different potential finishes each with a probability of around 10% or more.
(Update @ 2pm on Monday:
Only one ladder-related market remains available on TAB Sportsbet, the Finals market, and it has Hawthorn at $1.02, the Roos at $11, and Melbourne at $51. At those prices there's no value on offer.)
Two of the markets for final ladder positions are no longer being offered by TAB Sportsbet. Collingwood's victory over the Cats has, it seems, all but determined the destination of the minor premiership, and the Lions' last-gasp win over the Eagles has done something similar for the Spoon.
Minor Premiership Market
Across the 100,000 simulations run this week, four teams finish in 1st place in at least one simulation. However, in 98% on those simulations, it's the Pies that take the minor premiership. That's why there's no longer a market being offered on this result.
The Cats finish 1st in about 2% of the simulations, while St Kilda and Freo each take out the minor premiership in so small a fraction of the simulations that we might as well call it none.
Top 4 Market
Collingwood is assured of a Top 4 spot - in none of the simulations could my script create a scenario that dumped the Pies out of the first four spots - and Geelong is virtually assured of another.
The Saints' and the Dogs' chances are also very good. In the simulations they missed the top 4 only about 3 or 4% of the time. When one of them did miss it was Fremantle that grabbed the spot. The simulations suggest Fremantle is about a 6% chance of finishing in the top 4.
Based on the simulation results there's a tiny edge in backing the Saints at $1.03, which is the price that the TAB's currently offering. I wouldn't be rushing though as the fair price is only about $1.02.
Finals Market
Hawthorn's loss to Sydney significantly reduced their chances of making the finals, knocking 18% points from their probability, which dropped it to 73%. Losses by Port Adelaide and Adelaide all but eliminated their already-slim chances of participating in September.
The probability surrendered by Hawthorn, Port and the Crows was transferred to the Swans, whose probability rose 10% to 86%, to the Blues, whose probability rose 7% to 94%, and to the Roos, whose probability rose 9% to 26%.
Amongst the five teams on which TAB Sportsbet is willing to field bets for a top 8 finish there's only value for three of team - Carlton, Sydney and Hawthorn - and the edge on each is again small.
The Spoon Market
West Coast took out the Spoon in about 94% of the simulations, Richmond in about 5%, and the Lions in a bit less than 1%. The TAB Sportsbet bookie doesn't feel inclined to frame a market based on these lopsided chances so the market no longer exists.
Here are the full results of the new simulations.

Next, a summary of the same 100,000 simulations showing each team's most likely ladder finish, other relatively high-probability potential finishes for that team, and the best and worst ladder positions that the team occupied in at least one of the 100,000 simulations.

Notice how much more compact are the distributions of final ladder positions for the teams currently towards the top or the bottom of the ladder than they are for the teams mid-ladder such as the Roos, Melbourne, Adelaide, the Dons and Port. Melbourne, for example, finished as high as 6th in about 3% of the simulations and as low as 14th in a very small fraction of them.
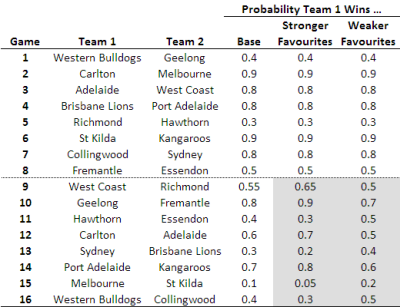
To help you with your own prognostications about the makeup of the final 8, here's a table showing which teams meet in the remaining 3 rounds and the most likely result as determined by the MARS-Rating based model I've used for the simulations:

We've just 2 rounds to go now until teams start creating the history that fans will remember - fondly or otherwise - and neither the top 4 nor the top 8 positions are all locked in. Surely the practical science of statistics can help us to determine the chances for each team that is still in the running.
To simulate the possible outcomes for the season's remaining games we need to:
(For anyone who's curious, in the second step I use the fact that I've determined empirically - as chronicled over on MAFL Stats - that there's a direct link between a team's probability of victory and the handicap it can expect to receive on line betting, and that handicap-adjusted margins seem to roughly follow a Normal distribution with a mean on 0 and a standard deviation of 37.7 points.)
I've completed the steps above using 3 different sets of probabilities, as set down in the table below:
The three scenarios are labelled Base Case, Stronger Favourites and Weaker Favourites, with the probabilities for the first 8 games in each scenario based on the opening head-to-head market prices on TAB Sportsbet and the remaining probabilities set to be broadly consistently with the scenario name.
So, for example, in the Base Case scenario, West Coast are slight favourites over Richmond in Round 22, as they have an assigned probability of 55% (ie 0.55). This rises to 65% in the Stronger Favourites scenario and 50% - that is, equal favouritism - in the Weaker Favourites scenario.
Okay, now to the interesting part: what outcomes do we get for each of these scenarios?
Here's the summary detail for each team of the probability of Top 4 and Top 8 finishes and the most likely ladder position under each of the scenarios:
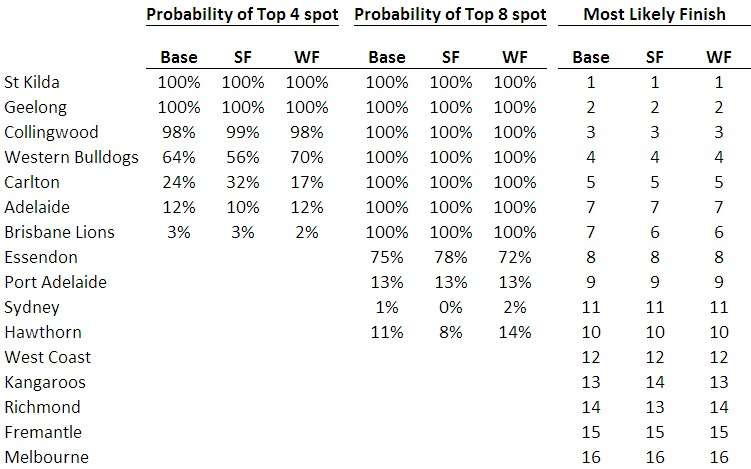
Across the scenarios, we find that:
No other team finished in the Top 8 in any of the simulations for any of the scenarios.
All of which means that, if you believe the probabilities I've used for the scenarios:
Which is probably why, on TAB Sportsbet, there is no longer a Spoon market.
Well last weekend's results certainly altered the finals landscape, leaving all of the teams currently in ladder positions 1 through 11 with legitimate dreams of playing in September and all of the teams in positions 1 through 7 with hopes for a top 4 finish and the double chance.
With the aid of the latest ELO projections, let's take a look at what's left for the teams in contention.
St Kilda have probably the easiest run home of all the teams in the competition. They face 9th placed Essendon away (hence the '9', the 'Ess' and the 'A' in the entry for St Kilda for Round 20, which is coloured green because ELO predicts the Saints will win this game), 13th placed Kangaroos at home, and then last placed Melbourne away. So, give them three wins and 1st place, with only the Dons as a realistic threat to a 22 and 0 home-and-away season.
Geelong have a slightly more challenging finish, starting with faint-hope finalists Sydney away this weekend, followed by the Dogs away, and then Fremantle at home. They should win all three of these games; regardless, they finish 2nd.
Collingwood face the in-form but out-of-contention Richmond this weekend, before matching up with the Swans in a game that'll matter much more to the Swans if they've knocked off the Cats in Round 20. In the final round the Pies take on the Dogs, but by that point they will most likely have secured 3rd place.
The Western Bulldogs have an horrendous last 3 weeks of the home-and-away season comprising contests with teams no lower than 5th on the ladder. First up is an away game with the Lions, then a home game against the Cats, and, finally, another home game, this one against the Pies. ELO has them winning 2 of these 3 contests and therefore securing 4th spot on percentages, but it's easy to see them dropping another 1 or even 2 of these games and missing a top 4 spot.
Carlton have what could be described as an awkward finish to the season, including as it does two teams that are in finals contention: Port Adelaide, who they play away this week, and Adelaide, who they play at home in the final round. In the middle they have the 4-point insurance that comes from playing the Dees. ELO has the Blues winning 3 and they should at least manage 2, making them a possible top 4 finisher.
Adelaide also have an awkward finish, starting with the 'surprised to still be in it' Hawks away this weekend, followed by the Eagles at home, and rounding out with a tricky away contest against the Blues. ELO's credited them with 2 wins, though you could make a good case for 1 or for 3 wins. The Crows should comfortably make the 8 and might yet surprise and jag a top 4 spot, but I'd treat this as unlikely.
If awkwardity is quantifiable (or, indeed, even a word) then the Brisbane Lions have more of it in their run home than any other team. This weekend they face the Dogs at home, then Port again at home, and, lastly, Sydney away, who might still have a sniff at that point but probably won't. ELO's giving the Lions just 1 win from that lot, but 2 is conceivable, even 3 if the gods of oblate spheroids are smiling on them. They'll make the 8 but almost certainly not the top 4.
Hawthorn can, amazingly, lose again this week - to the Crows at home - but still sneak into the finals with back-to-back wins against Richmond away and Essendon at home to complete a 10-12 season and pip Port on percentages. One possibility is that the Hawks will face the Dons in Round 22 with a place in the finals at stake for both of them.
Port Adelaide could also slip into the 8 with just 40 points and having lost 2 of their last 3 games. They face Carlton at home this week, then the Lions away and the Roos at home. If they can win 2 of these then the Hawks will need to win all 3 of theirs to deny Port a finals berth.
Essendon will probably finish just 1 win short of the finals. They play Saints at home this week, then Freo away and then the Hawks also away. It might, as I noted above, all come down to the Round 22 clash with the Hawks.
Sydney have the faintest of finals hopes, but would need to topple the Cats at home, Collingwood away, and then the Lions at home to realise that dream. Frankly I think I'm more likely to win Lotto - and I don't even buy tickets.
For the rest of the teams it's all about draft picks and dealing with tanking speculation.
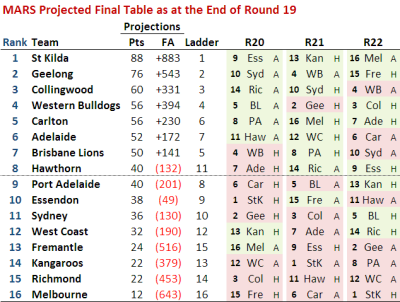
The top 8 of the MARS Projected Final Table after Round 18 differs from the current ladder only in that Adelaide and Collingwood trade places. MARS predicts that Adelaide will grab 4th spot on the back of four straight wins over the remainder of the season, skipping them past the Pies, who win only two more, beating Richmond and Sydney but losing to Adelaide and the Dogs.
Under the MARS scenario, 4th place will still be undecided as we move into Round 22.
Here's MARS' current projected final table and the predicted results that will produce it:

The key clash for Adelaide looms as the Round 20 matchup with the Hawks, which MARS has the Crows winning by a point. Assuming that Hawthorn lose in Round 19 to the Saints and beat Richmond and Essendon in Rounds 21 and 22, Hawthorn will need to down the Crows to have a chance at securing 8th spot, knocking Port out of the eight and relegating the Crows to 5th, behind the Pies.
Collingwood might otherwise grab a spot in the top 4 if they defeat the Bulldogs, as might the Lions if they, instead, beat the Dogs.
Essendon are projected to miss the 8 by two games, as MARS forecasts them to lose to the Lions, St Kilda and Hawthorn, securing a solitary victory over a floundering Fremantle in Round 21.
Sydney, though still a mathematical chance to reach 44 points and therefore press for a finals spot, would need to topple Richmond, Geelong, Collingwood and the Lions in successive weeks to do so, which seems about as likely at the moment as the AFL relenting and changing the rules for the draft.
With just 6 rounds to go in the competition, a few articles are emerging about how the teams will fare over the remainder of the season and, most importantly, who'll finish where in the top 8.
Using the MARS Ratings from MAFL Stats I've also predicted the results for the remainder of the season, details of which appear below:

On the right of the table I've provided the game-by-game projections for each team. Green boxes denote victories, red losses, and a bracketed "H", "A" or "N" denote Home, Away and Neutral Ground venues respectively.
If these projections are accurate, there's not a lot of change that we'll see amongst the top 8. In fact, we'll see no change at all in terms of its membership and only a couple of significant changes in terms of its ordering.
Carlton, I'm forecasting, will leap 3 places and secure a top 4 spot, beating Collingwood (currently 4th), the Roos (12th), Port (9th), Melbourne (15th), and Adelaide (6th) in so doing, losing only to the 2nd-placed Geelong in Round 19. This string of results will draw Carlton level with the Lions on 56 points, but will see them grab 4th with a superior percentage.
Collingwood will surrender their top 4 spot, dropping to 6th due to losses to Carlton (7th), Adelaide (6th), and the Dogs (3rd). Victories over the Lions (5th), Richmond (14th), and Sydney (11th) won't be enough.
Port Adelaide and Hawthorn are projected to finish level with the Dons on 44 points but will miss a spot in the eight on percentages, in Hawthorn's case despite finishing the season with a three-game winning streak.
The last three weeks has had quite an effect on ELO's projected end of season ladder, as you can see in the table below.

The top 3 positions are unchanged, firmly held by the Cats, Saints and Dogs, but there's significant movement amongst the next 8.
Carlton moves from the fringes of the top 8 into 4th, dethroning the Pies who drop to 6th. The Lions and Sydney - both now projected to win two more games than thought previously - move into the top 8 at the expense of the two Adelaide teams, who both now miss out on a finals spot based on (my proxy of) percentages.
Making the final 8 now requires 11 wins, which is more in keeping with seasons past than the 10 wins that were projected previously. Also, the teams that make up the projected final 8 are the same teams that currently occupy the top 8 teams on the competition ladder.
Positions 11 through 16 are all held by the same teams as in the earlier projections, albeit that there's been some interesting but inconsequential rearrangements. Unrearranged though is Melbourne, now projected to lose all of its remaining games.
This year I've adapted the ELO-based MARS Rating system so that it now provides a margin of victory as well as a tip for each game. Based on the current ratings, these margins and tips can be generated for all the remaining home and away matches and these, in turn, can be combined with the existing table to arrive at a projected end of season table.
Well, I've just done this and the results appear below.

(Because MARS provides a margin but not a score for each game, I've had to use the difference between points for and points against - rather than percentage - as my tiebreaker when teams are equal on competition points. Generally the two approaches will produce the same ordering, but not always.)
Our projections have Hawthorn and Adelaide slipping into the top 8 at the expense of the Lions and the Dons.
Adelaide is a particularly interesting case to look at. It is projected to finish 7th despite currently being 12th on the ladder and ranked only 10th on current MARS Ratings. So, how can it be projected to climb 5 ladder positions? It's on the strength of its easier draw for the remainder of the season.
Collingwood is another team that appears to benefit from its draw according to MARS Ratings, though less so than does Adelaide. The Pies are projected to finish 4th despite currently being 8th on the ladder and ranked only 5th by MARS.
In contrast to Adelaide and Collingwood, Carlton suffers, to a small degree, from a difficult remaining draw, evidenced by the fact that its projected final ladder position is below both its current ladder position and its current MARS Ranking. All other teams are projected to finish in a position that is between (or equal to) their current ladder position and current MARS Ranking.
One other notable feature of the projected ladder is that it takes only 10 wins to make the final 8 whereas, historically, it has usually taken 12 or 13 wins. This is due to the projected dominance of Geelong and St Kilda; their combined projected 43 wins doesn't leave many points to go around.
MAFL is a website for ...
![]() Click on the envelope
Click on the envelope
Copyright © 2006-2023, Tony Corke. All rights reserved.
