Probability Score as a Predictor of Profitability
/This year, one of the performance measures we're tracking for the Probability Predictors is their Probability Score, which for this season I've defined as follows:
Probability Score for Game i = 1+log(Prob(i))
where Prob(i) is the probability that the Predictor has assigned to the winnng team in game i, and the log is to base 2.
This metric rewards Predictors for probability assessments of the winning team that are closer to 1, but heavily penalises probability assessments that are close to 1 if they're made for the team that eventually loses. With a little maths, it's not hard to show that the optimal probability to assign to team X in game i is the a priori probability of team X winning game i. As such, the metric rewards calibration.
For the current blog the questions we'll be exploring are:
- whether a Predictor's probability score has any relevance to its ability to produce a profit
- the relationship between a Predictor's probability score and the bias and variability of its probability assessments
- for a Predictor that produces probability assessments that generate a given probability score, whether Kelly-staking or Level-staking is more profitable
Time then for a few more simulations using the five-parameter model, this time with the following setup:
- 1,000 season replicates with 185 games per season
- Overround is 106% (which is about where the TAB Sportsbet bookie's head-to-head markets usually wind up close to game time)
- Bookie Bias of -1% (which is about the estimated bias for the period 1999 to now)
- Bookie Sigma of 5% (also approximately the estimated value for the same period)
- Punter Bias takes on a value at random uniformly between -10% and +10%
- Punter Sigma takes on a value at random uniformly between 0% and 25%
Probability Score and Kelly Betting
First, let's consider Kelly-staking each game on the basis of our probability predictions.
From the 1,000 replicates, using rule-induction, we can build the following 2 rule model to describe Kelly-staking profitability using only the probability score as a predictor:
- If the Probability Score is less than 0.035 per game then Kelly-staking will be unprofitable (accuracy 91%), otherwise
- Kelly-staking will be profitable (accuracy 91%)
So, regardless of the Punter Sigma or Bias values that produced the Probability Score that we witnessed, if the Probability Score exceed 0.035 per game there's about a 90% chance that it was associated with profitable Kelly-staking.
A relationship exists between the Probability Score that a Predictor produces and the Bias and Sigma that produced it. A little equation-fitting with Eureqa produces an empircal description of that relationship for the data from the simulations that explains 99.8% of the variability in Probability Scores.
Predicted Prob Score per Game = 0.126 + 0.005 x Sigma - 4.771 x Punter_Sigma^2 - 4.540 x Bias^2 - 0.069 x Bias
That equation looks like this when it's graphed:
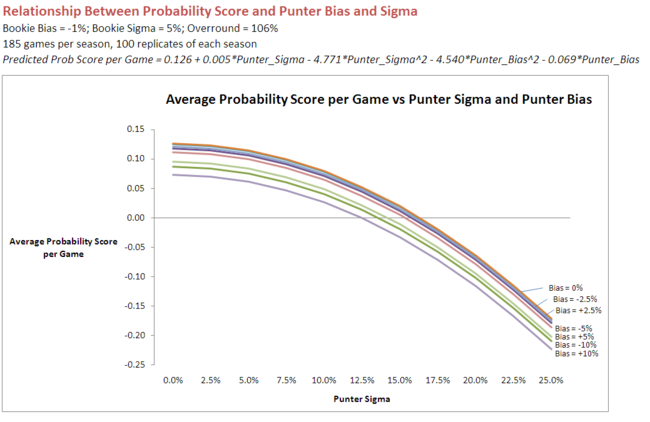 It's interesting to note how the curves, each pertaining to a different value for Bias, fall off initially quite slowly with increasing Sigma. Only when Sigma reaches about 10% do we find significant Probability Score penalties for increased variability.
For a given value of Sigma, the penalty for Bias is such that moving from a zero Bias to a -10% Bias (ie in the same direction as the Bookie's own Bias) leads to an expected reduction in Probability Score of 0.038 per game, while moving from a zero Bias to a +10% Bias (ie in the opposite direction to the Bookie's Bias) leads to an expected reduction in Probability Score of 0.052 per game.
Knowing as we do know that a Probability Score of 0.035 per game makes it quite likely that a Kelly-staking punter will be profitable, we can use this equation to determine what combinations of Bias and Sigma will produce Probability Scores of at 0.035 per game or more (given all the assumptions we've made earlier about overround, bookie bias and bookie variability).
Rearranging the equation we end up with a quadratic equation for the Bias for which we can find the roots and produce the following table:
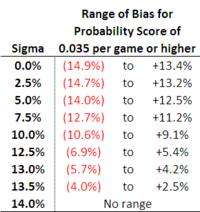
A Kelly-staking punter with low variability (Sigma) can turn a profit from a broad range of biases. As Sigma increases, the profit-making range of biases shrinks until a Sigma of just under 14% is reached, at which point a profit isn't possible regardless of the size (or complete absence) of any bias.
Probability Score and Level Staking
Just as we produced two rules to describe the relationship between profitability using a Kelly-staking approach and Probability Scores, we can do the same for a Level-staking approach:
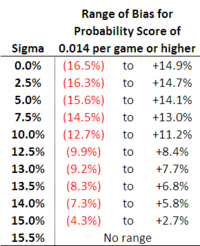
- If the Probability Score is less than 0.014 per game then Level-staking will be unprofitable (accuracy 83%), otherwise
- Level-staking will be profitable (accuracy 88%)
Comparing these rules to the ones we created previously for Kelly-staking we can see that profitability is possible with smaller probability scores if we use Level-staking instead of Kelly-staking.
Put another way, our probability assessments can be more biased for a given level of variability if we Level-stake rather than Kelly-stake, which you can ascertain by comparing the table below to the earlier one for Kelly-staking:
Level-Stake or Kelly-Stake
For now that leaves just one obvious, unanswered question: given that I know the probability score my probability assessments are producing, should I Level-stake or Kelly-stake?
One last bit of rule induction produces the answer:
- If the Probability Score is less than 0.072 per game then Level-staking is superior (accuracy 86%), otherwise
- Kelly-staking is superior (accuracy 87%)
