Swings and Roundabouts in the 2014 AFL Draw
/The GWS Giants have, according to one analysis at least, the worst draw of any team in the competition in 2014.
One of the things from which they suffer, of course, is being denied the opportunity to face the lowest-Rated team in the competition (aka themselves), which means that the average quality of their potential competition is necessarily higher than the average quality for every other team.
But, GWS also suffer from a particularly difficult away draw that sees them face Brisbane at the Gabba, last year's Grand Finalists, Fremantle and also West Coast at Subiaco, Hawthorn and Richmond at the MCG, and St Kilda at Docklands.
 The next-worst draw, as you can see in the table at left, belongs to Essendon, who have an even more daunting away schedule than the Giants. Their 11 away fixtures include Brisbane, Carlton, Fremantle, Geelong, Richmond, Sydney and the Kangaroos (who are Rated more highly than their ladder-position finish last year might suggest, the basis for which statement I'll come to a little later).
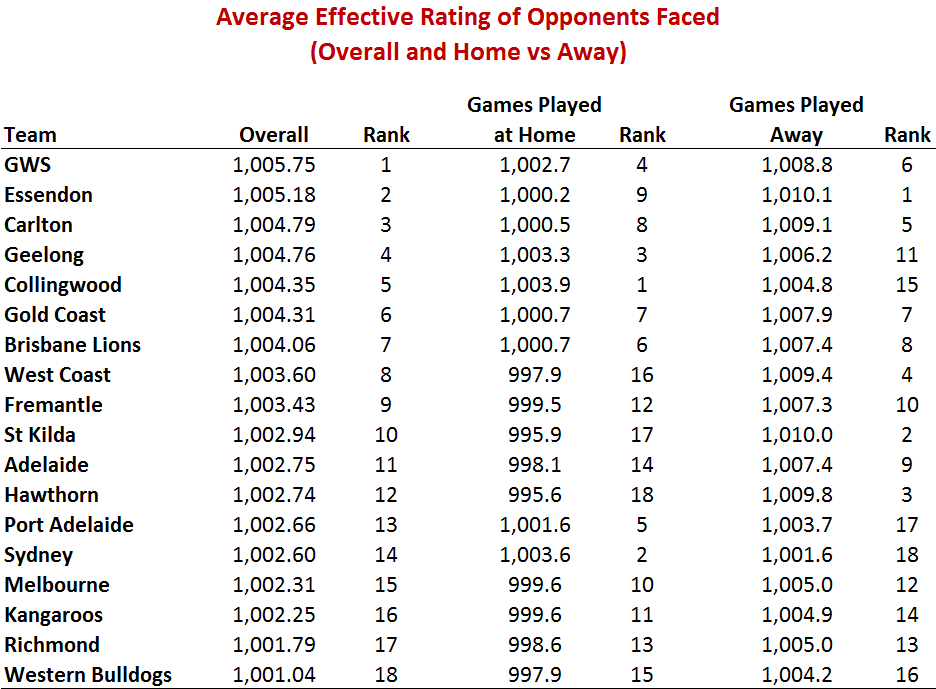
Each team's schedule strength is reflected in this table as the average Rating of the opponents they face across all 22 games ot the regular home-and-away season. Higher numbers reflect on average stronger opponents, and lower numbers on average weaker opponents.
The Ratings under the Overall heading relate to the strength of each team's schedule combining home and away fixtures, while those in the middle pertain solely to home games for the team in question and those on the right solely to away games. These latter numbers tend to be higher because they incorporate an adjustment to each home team's Rating to reflect home ground advantage, which in most cases is a positive quantity. In short, a team will tend to face effectively stronger opposition when playing away than when playing at home.
Based on the Overall numbers we can group all 18 teams in terms of their schedule strength as follows:
- Tough Draw: GWS, Essendon, Carlton and Geelong
- Moderately Tough Draw: Collingwood, Gold Coast, Brisbane Lions, West Coast and Fremantle
- Average Draw: St Kilda, Adelaide, Hawthorn, Port Adelaide, Sydney, Melbourne and the Kangaroos
- Easier Draw: Richmond and the Western Bulldogs
So, amongst last year's Finalists, two (Carlton and Geelong) are faced with Tough draws, two more (Fremantle and Collingwood) with Moderately Tough draws, three (Hawthorn, Sydney and Port Adelaide) have draws classified as Average, and only one (Richmond) find themselves with a draw that seems a little Easier.
(It is, surely, a coincidence that the Dons find themselves in the Bucket of Death this season ...)
THE METHODOLOGY
To arrive at the numbers in the table just presented I needed to quantify the strength of every team and to adjust it depending on where they were playing. For this purpose I drew on some recent team rating analysis I've been undertaking over on the Statistical Analyses blog (see here, here and here) where I've created a series of Very Simple Rating Systems (VSRSs) that are, like MAFL's MARS Rating System, ELO-based. They differ from MARS Ratings, however, in that:
- Differences in team Ratings have a natural interpretation: they're the amount by which we'd expect the team with the higher Rating to defeat the team with the lower Rating in a game played on a neutral venue.
- There are more tunable parameters in the VSRS that I've used for this blog than in the MARS Rating System. Instead of a single parameter to reflect home ground advantage, the VSRS I'm using here includes measures of home ground advantage for all common combinations of home team and venue.
 Part of the tuning process for the VSRS involved taking the game results for seasons 1999 to 2013 and using them to derive "optimal" estimates of every team's home ground advantage (HGA) at every venue. The values relevant to 2014 contests appear in the table at left and can be interpreted as the extra scoring that a team is expected to do at a particular home venue after accounting for the quality of the opposition it is facing.
Geelong, for example, when playing at Docklands have enjoyed the greatest HGA of all. They've scored in home games played at Docklands (which will include Finals in which they were the higher Rated team) over 4 goals more than would have been expected on the basis of the strength of the opponents they were facing. In season 2014 they'll play just two home-and-away games at Docklands: against Carlton in Round 12 and against Essendon in Round 15. The Cats' historical strength at this venue is part of the reason that the Dons and the Blues are assessed as having the second- and third-worst overall draws - and the worst and fifth-worst away draws - of any team this season.
A number of other team-venue combinations are associated with HGAs of more than two goals, and about a dozen more have smaller but still positive HGAs. There are also eight combinations of home team and venue for which historical data is either scant or non-existent. It would be a brave analyst indeed who'd be willing to estimate the Saints' HGA at Wellington Stadium on the basis of a single game, or the Dees' HGA at Tragear Park where they've never played. So, for all eight such combinations, I've set the HGA to zero (though acknowledging that a case could be made for applying some small positive HGA to games played at Adelaide Oval with Adelaide or Port Adelaide as the home team, at least for games played against interstate opposition).
Finally, there are six combinations of team and venue, two of them involving the Pies, where history suggests that the home team has scored less than can be accounted for by the differences in team Ratings at the time. In other words, there are six venue and team combinations where the HGA is negative. The most dramatic of these is for Collingwood home games at Docklands where the Pies have, on average, scored over 5 points fewer than we'd expect given the strength of the opponents they faced.
In addition to estimates of HGA we need estimates of base team Ratings. These too have been derived using the VSRS described in this blog (specifically, the variant in which Mean Absolute Error is minimised).
 That VSRS produced the Ratings of the teams as at the end of last season as shown in the table at left under the End 2013 column. The team ordering is a little surprising in that the Kangaroos wind up with the second-highest team Rating and the Tigers finish fourth, but the correlation between the Ratings shown here and the final MARS Ratings for season 2013 is +0.995, so these VSRS Ratings are clearly broadly measuring the same notion of ability as is MARS.
Like MARS, the VSRS has a carryover parameter that determines the extent to which teams carry their end-of-season Rating into the next season. In MARS, teams retain a little less than one-half of their Rating while in the VSRS they retain fractionally more than one-half. The result of applying that VSRS carryover fraction to the teams' end of season 2013 Ratings is shown in the column headed Start 2014. It's these Ratings that are used as the base team Ratings for all games throughout 2014.
These Ratings are then adjusted in each game to account for home team status and venue. So, for example, when Geelong are playing at home at Docklands they are effectively Rated at 1,011.6 (Base Rating) + 24.6 (HGA) = 1,036.2, which rates them a 6-goal better than average team in games played at this venue. It's the averages calculated in this manner for every game that have been used to determine each team's strength of schedule.
Details of this calculation for each game are as follows:

Apart from providing information about the effective Rating of every team's opponents in every game, this table also shows the teams that are played twice and those that are played only once during the course of the season. Adelaide, for example, miss out on playing Brisbane, Carlton, Essendon, Fremantle, Geelong and the Western Bulldogs at home, and the Gold Coast, Hawthorn, Melbourne, Richmond, Sydney and West Coast away.
IMPACTS OF THE IMBALANCED DRAW
The fact that teams actually play only about two-thirds (ie 22 of 34) of the games they would play under an all-plays-all home-and-away schedule allows the AFL to tinker with the average strength of the opposition that each team meets. The final result of this "rebalancing" is recorded in the first table of this blog where we see, for example, that GWS, on average, face teams that are about 4.7 points per game stronger than those faced by the Western Bulldogs.
How much of that difference, you might ask, is due to the higher average quality of teams in the competition once you exclude GWS compared to the average quality once you exclude the Western Bulldogs, and how much of it is AFL-induced?
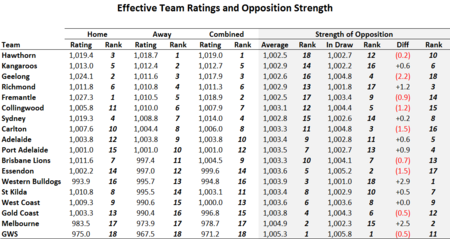 The Ratings shown in the "Home" section of this table are the average Rating of each team when playing at home, taking into account the HGA at each venue and the proportion of the team's home games that are played at each venue. So, for example, Hawthorn's Home Rating is its base rating of 1,018.7 plus 4/11ths of its Aurora Stadium HGA and 7/11ths of its MCG HGA, which is 1,019.4.
Adjusting for HGA for all teams we find that Fremantle is the highest-Rated team in the competition when playing at home and GWS (still) the lowest. The difference in the team rankings based on their Home and their Away Ratings shown here highlights:
- the benefits to interstate teams generally of playing in their home state (for example, Fremantle climb from 5th to 1st, and the Lions from 11th to 7th)
- the penalty paid by Victorian teams in sharing home grounds (for example, Collingwood fall from 6th to 11th, and the Roos from 2nd to 5th), and
- the penalty (assumed by me) this year for Adelaide and Port Adelaide in playing at an unfamiliar venue (they fall from 9th and 10th to 12th and 15th respectvely).
These effects are also evident in the Combined Ratings where we find that Fremantle are, once HGA is accounted for, the second-highest Rated team overall and Sydney the fourth-highest.
With that by way of background we can move to the grey section of the table, which provides the answers to the question posed at the start of this section.
The numbers under the Average heading in this section are the average Combined Rating of all teams in the competition excepting the team under consideration. So, for example, the entry for Hawthorn is the average Combined Rating of all teams in the competition except Hawthorn and is the average strength of opposition that Hawthorn could expect to play in an all-plays-all home-and-away competition (strictly speaking, where the venues for each game were chosen at random from amongst the available venues for the designated home team with the proportions set according to the actual proportions played at each venue in the current 2014 draw).
In a rational and fair universe therefore, Hawthorn might expect to face, on average, teams with Combined Ratings of 1,002.5, which would leave them with the easiest draw in the competition.
The column headed In Draw provides details of the average strength of the opposition actually faced by each team. Geelong, for example, are confronted with a draw where the average opponent has a Combined Rating of 1,004.8, which is 2.2 points per game worse than an all-plays-all home-and-away schedule would deliver them.
That figure of 2.2 appears under the column headed Diff and it's here that we measure the net effect of the AFL's efforts to use the curtailed draw to achieve their desired competition-balancing outcomes. Numbers in red represent cases where the average strength of the opposition faced by a team in the actual 2014 Draw is higher than would be expected under an all-plays-all home-and-away schedule, while numbers in black represent cases where the opposite is true.
On this relative metric then, the Draw is kindest to the Dogs, the Dees and the Tigers, and cruellest to Geelong, Essendon and Carlton. The analysis here also reveals that GWS, while is should be expected to have a tough draw in absolute terms on the basis of the average quality of the other teams in the competition, actually fairs worse in the Draw as constituted than an all-plays-all home-and-away draw would have delivered.
I'll finish with one last table, which summarises each team's draw according to the ladder-position finishes of that team's opponents as at the end of season 2013.
 As you're reviewing this table, bear in mind that the AFL reportedly constructed the draw for 2014 partly on the basis of the third of the ladder in which each team finished. As evidence for this you can see that, in total, Adelaide is scheduled to play 7 games against the teams that finished in the Top 6 last season, and that the Brisbane Lions are scheduled to play 8.
If you work your way through the remaining teams you'll find that the Western Bulldogs are the only team to play fewer than 7 games against these teams, and that no team plays more than 8 games against these stronger opponents.
Similarly, if you review team schedules against opponents from ladder positions 7th to 12th you'll find that every team plays exactly 7 or 8 games against this group, and if you review team schedules against opponents from ladder positions 13th to 18th you'll find that every team except Geelong plays exactly 7 or 8 games against these opponents (Geelong plays only 6 games).
You can apply your own weightings to this table to come up with an alternative assessment of the schedule strength of every team.
