Optimising the Very Simple Rating System (VSRS)
/In the previous blog, introducing the VSRS, I provided optimal values for the tuning parameters of that System, optimal in the sense that they minimised either the mean absolute or the mean squared error across the period 1999 to 2013 under the following assumptions:
- That the predicted margin in any game was equal to the difference in the teams' Ratings, adjusted for the optimised value of Home Ground Advantage
- That all teams started with a Rating of 1,000 as at the commencement of the 1999 season, excepting Gold Coast and GWS whose initial Ratings were treated as additional tuning parameters
For that blog, I chose to optimise the VSRS for the period 1999 to 2013 merely for convenience - the file I use for the MAFL Funds just happens to cover this timeframe. Today I want to extend and alter the approach I adopted in that earlier blog in a number of ways:
- By finding optimal values of the tuning parameters for the VSRS that could be applied to the entire history of the VFL/AFL
- By finding optimal values of the tuning parameters for that VSRS that could be applied to the entire history of the VFL/AFL, but that would optimise some metric considered only across the last 14 seasons and not across the entire history of the sport
- By considering metrics other than absolute and squared error
- By treating the initial Ratings of the Gold Coast and GWS in the same way as the initial Ratings of every other team - that is, by assuming that they both start Rated 1,000.
METRICS TO OPTIMISE
I'll be constructing six separate VSRS' across the two expanses of history (so that's 12 in all), each optimising a different metric:
- Root Mean Squared Error (RMSE) : calculated as the square root of the average squared difference between the actual and predicted game margin
- Mean Absolute Error (MAE) : calculated as the average absolute difference between the actual and predicted game margin
- Mean Absolute Percentage Error (MAPE) : calculated as the average absolute difference between the actual and predicted game margin expressed as a percentage of the total points scored in the game. So, for example, a 10 point error in a game that finished 105-95 would represent a 5% error. I included this metric as a way of adjusting for the differences in average game aggregates across the history of VFL/AFL. Note that this MAPE is a different MAPE to the metric typically used in assessing the performance of Margin Predictors here on MAFL.
- Accuracy (Acc) : calculated as the proportion of games in which the sign of the predicted margin matches the sign of the actual outcome, with draws counting as one half.
- Average Brier Score (BS) : calculated as the average of the squared difference between the result of each game expressed as a 0/1 variable (0.5 for a draw) and the probability associated with that result. For this metric I need a way to convert team Ratings into probabilities, which I'll discuss in a moment.
- Combined Metric : calculated as a weighted sum of centred versions of the five metrics just described, with centring based on the average per-season value of each metric when "reasonable" values of the tuning parameters are used, and with weights based on the standard deviations of the per-season value of each metric under the same conditions. For more details, see the legend in the table below.
USING THE VSRS TO COME UP WITH PROBABILITIES
The VSRS can readily be used to generate margin predictions for a game - indeed, that's the basis on which the VSRS was conceptualised. The difference between two teams Ratings is meant to be a proxy for the difference in their skills, measured in points scoring differential, so a team Rated 15 Points higher than another is expected to score 15 points more than that team, ignoring any Home Ground Advantage (HGA).
The simplest way I can think of to convert these margin predictions into a probability prediction is to divide them by some constant and then apply the logistic transformation.
In other words: Predicted Victory Probability = 1 / (1+exp(-(Predicted Margin/Divisor)))
To use this formula we need to determine a value for 'Divisor', which I've estimated by treating as another tuning parameter for the VSRS.
THE RESULTS
The table below provides values for the four VSRS tuning parameters - five when the metric to be optimised requires game probabilities to be determined - that optimise the stated metric across either the entirety of VFL/AFL history (the top half of the table) or across only the last 14 seasons (the bottom half). Optimisation has again been performed using Excel's built-in Solver capability, so there's no guarantee that the putative optima are global rather than local.
Also provided in the table are the values of each metric for each set of tuning parameters.

ALL-TIME OPTIMA
In the top half of the table, the first column provides the results of attempting to optimise the RMSE metric across the entirety of VFL/AFL history.
The results here suggest that Home Ground Advantage (HGA) has averaged out at about 7.7 points per game across the entire history of the sport; that the optimal way to adjust Ratings has been to take about 8.35% of the Ratings- and HGA-adjusted game margin, capped at about 100 points; and that the best estimate of a team's ability in a new season is to take about 70% of its Rating at the end of the previous season and then add 300 Ratings Points.
Adopting that approach yields Ratings that produce an RMSE per game of 34.2 points, an MAE of 26.7 points, an MAPE of 16.1%, and an Accuracy of 69.4%. In other words, by applying this methodology you could have tipped the winner in almost 70% of all contests decided since the competition began - without accounting for player availability, weather, coaching staff, scandal, misadventure, rumour, innuendo or misfortune.
The second column provides optimal values for the same tuning parameters, but optimises MAE instead. They produce, as they logically must, a System with a slightly smaller MAE, but also with only a very slightly inferior RMSE and Accuracy, and a slightly better MAPE. Frankly, choosing between the performance of this System and that of the System in the neighbouring column is effectively a coin-flip.
The third column, which records tuning parameters that optimise MAPE, is not much different, nor is the fourth column, which optimises Accuracy. Even a simple intention to be right more often than not in the choice of a game's winner allows only an 0.33% point improvement in accuracy across more than 14,000 games.
Minimising the Brier Score of predictions leads to optimal values of those tuning parameters common to all variants that are only slightly different to those estimated for other VSRS', but also requires the estimation of a new parameter, the divisor used in converting Ratings differences into probability assessments, which turns out to have an optimal value around 16.5. That collection of optimised parameters results in a VSRS with an average per-game Brier Score of 0.194.
In the last column we have the optimised parameters for an all-round System that seeks to minimise a weighted average of the five metrics so far considered. Objectively, this System does a very good job: it's never more than about 0.4% shy of the performance on any metric of the VSRS specifically designed to maximise some metric.
This Pretty Good All-Time VSRS (PGAVSRS) has:
- HGA = 7.2 points
- k = 8.8%
- Carryover = 52.9%
- Cap = 186 points (which is, essentially, no cap at all)
- Divisor = 17.7
OPTIMA FOR 2000-2013
Looking next at the lower half of the table we find that if we instead focus solely on the period from 2000 to 2013, though we calculate Team Ratings using the optimised parameters starting in 1897, then:
- The optimal values of HGA are a little higher, except when our metric of choice is Accuracy
- The optimal values of k are a little higher, except when our metric of choice is Accuracy or Mean Brier Score
- The optimal values of Carryover and Margin Cap are uniformly lower, except when our metric of choice is the Composite metric
- The optimal values of Divisor are higher, which implies that a given difference in Ratings translates into a smaller difference in victory probability
These optimal values produce uniformly inferior values of all performance metrics for the 2000 to 2013 period relative to the 1897 to 2013 period, which implies that prediction in the modern era has been more difficult - or at least, more dependent on ephemeral aspects of each contest - than prediction across the entirety of VFL/AFL history. No kidding ...
COMPARATIVE PERFORMANCE
You might wonder, as did I, how different is the performance of the VSRS' optimised for the entire history of VFL/AFL (including the all-round VSRS) compared with that of the VSRS' optimised solely for recent history.
This first chart shows the season-by-season MAE results for the VSRS optimised for MAE for the entirety of VFL/AFL history, the VSRS optimised only for the MAE in the 2000-2013 period, and for the all-rounder model optimised for the entirety of VFL/AFL history.

Practically, the performances of these three models are indistinguishable and show an ability to predict results with about a 4-goal average error until the mid-1970s when a 5 to 6-goal average accuracy became the norm.
In recent seasons the trend has been towards more-predictable outcomes with about a 5-goal error. As we've discussed before, the last couple of seasons have been especially predictable from a game margin viewpoint.
We know also from previous analyses that the ability to accurately assess the probability of a team's victory is crucial to wagering success. The Brier Score is one measure of that probabilistic accuracy, so we next look at the performance of the two VSRS' optimised for this metric and the all-round VSRS.

Again we find precious little to separate the performance of the three models, save mostly for a few years prior to the end of WWII.
In the lingo of stockmarket chartists, since about the mid-1980s season-average Brier Scores have traded in a narrow range from about 0.19 to 0.23 per game, only recently breaking out of this range to test lower values. Again, we find that the last few seasons have been more predictable than those preceding them.
Finally, consider the Accuracy metric, which has proven to be a more difficult metric to optimise, in part because of its inherently more discrete nature - when you're tipping a result, you're (draws side) either right or wrong; in comparison, when you're tipping a margin you can miss by just a little or a lot.
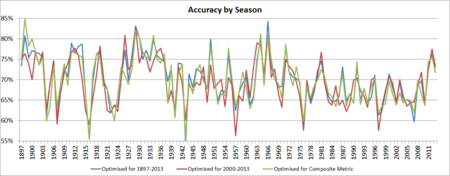
Here, the two VSRS models optimised for this metric do show differentiated performance from each other as well as from the all-rounder model, though the differences are still not vast for most seasons.
In the early years, Ratings allowed for the outcome of 70% or more of contests to be accurately predicted. Then, from the early 1900s to about the late 1970s, accuracy rates were highly variable, ranging from a coin-toss 50% to peaks of around 85%. Since then, predictive accuracy has generally ranged from about 65% to 70%, occasionally dipping below this until recently when higher values have been explored.
CONCLUSION
VSRS' with different values of the tuning parameters can be produced to optimise different metrics, though an all-round VSRS performs almost as well. The tuning parameters for that VSRS variant are provided above.
If you're looking for an all-purpose Team Rating System to use in 2014, a VSRS with those parameters should serve you well. Those parameter values produce Ratings at the end of the 2013 season as follows:
- Hawthorn1,032.1
- Geelong1,025.3
- Fremantle1,023.6
- Kangaroos1,020.2
- Sydney1,017.4
- Richmond1,015.8
- Collingwood1,013.5
- Adelaide1,011.2
- Carlton1,006.1
- Port Adelaide1,002.6
- Brisbane Lions 997.1
- St Kilda 993.4
- Essendon 992.7
- West Coast 990.2
- Western Bulldogs 987.4
- Gold Coast 984.0
- Melbourne 950.8
- GWS 936.8
