MAFL 2013 : Team Dashboard for Round 9
/This week I'll be highlighting significant differences between the teams' competition ladder positions and their Scoring statistics:
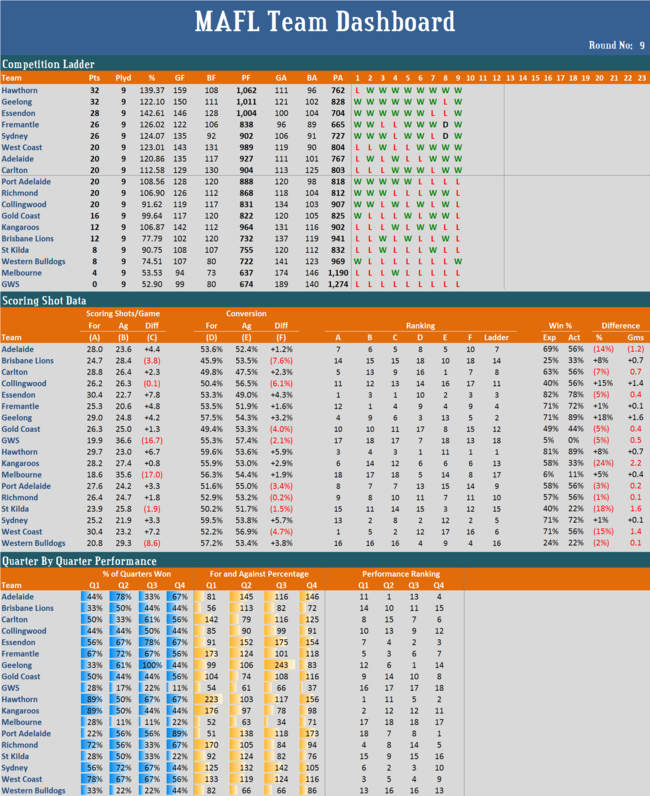
- Carlton are 8th on the ladder, but 1st on Opponent Conversion and 16th on Own Conversion
- Essendon are 3rd on the ladder, but 10th on Own Conversion
- Fremantle are 4th on the ladder, but 12th on Own Scoring Shots and 1st on Opponent Scoring Shots
- Geelong are 2nd on the ladder, but 13th on Opponent Conversion
- GWS are 18th on the ladder, but 7th on Own Conversion
- Hawthorn are 1st on the ladder, but 11th on Opponent Conversion
- The Kangaroos are 13th on the ladder, but 6th on Own Scoring Shots, Own and Opponent Conversion
- Melbourne are 17th on the ladder, but 5th on Own Conversion
- Port Adelaide are 9th on the ladder, but 15th on Opponent Conversion
- St Kilda are 15th on the ladder, but 3rd on Opponent Conversion
- Sydney are 5th on the ladder, but 13th on Own Scoring Shots and 12th on Opponent Conversion
- West Coast are 6th on the ladder, but 1st on Own Scoring Shots and 17th on Opponent Conversion
- The Western Bulldogs are 16th on the ladder, but 4th on Own Conversion
One feature from this list is the apparent lack of importance of Opponent Conversion rates - teams high up on the ladder seem to have poor Opponent Conversion statistics and teams lower on the ladder seem to have better Opponent Conversion statistics. Indeed, the rank correlation between ladder position and ranking based on Opponent Conversion is just +0.18.
What's mattered instead this season has been how many scoring shots opponents a team has allowed its opponents. The correlation between the ranking on that metric and ladder position now stands at +0.86.