MAFL 2013 : Team Dashboard for Round 8
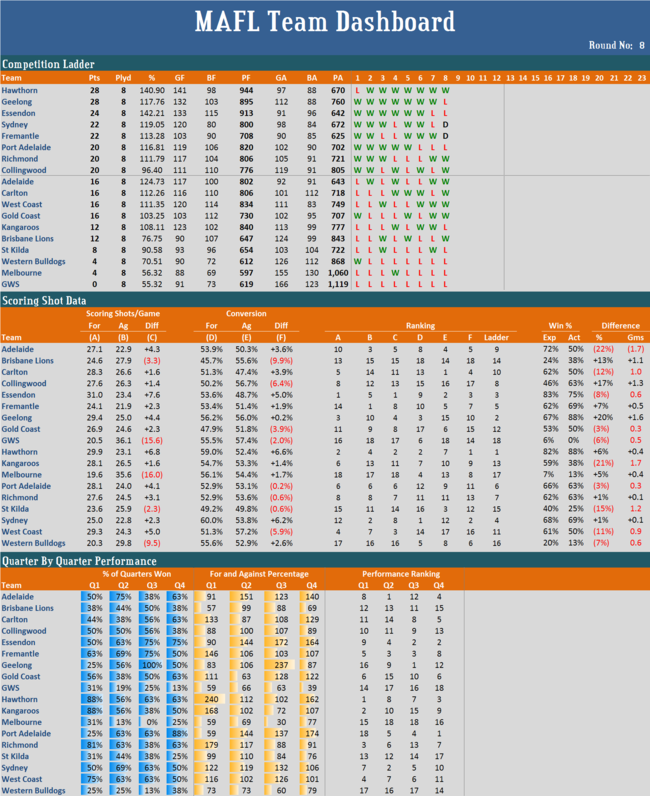
/This week I'll draw your attention to the right-hand portion of the Scoring Shot Data, which provides information about each team's actual performance in terms of competition points earned, relative to what might be expected based on the team's scoring shot metrics and the win production function I derived back in this blog from 2011. (Note that I'm using the first equation from that blog).
According to this analysis, the teams that have achieved significantly more wins than their scoring shot data would predict are:
- Geelong, who've won 88% of their games when their scoring statistics would predict a 67% record,
- Collingwood, who've won 63% of their games when their scoring statistics would predict a 46% record, and
- The Brisbane Lions, who've won 38% of their games when their scoring statistics would predict a 24% record
Confirmatory evidence for the relative good fortune of these three teams comes from the fact that both the Cats and the Pies have recorded 3 victories by less than 3 goals, and that the Lions have recorded 2 victories by less than 2 goals.
Conversely, the teams that have achieved significantly fewer wins than their scoring shot data would predict are:
- Adelaide, who've won 50% of their games when their scoring statistics would predict a 72% record,
- The Roos, who've won 38% of their games when their scoring statistics would predict a 59% record, and
- St Kilda, who've won 25% of their games when their scoring statistics would predict a 40% record
Again we can find support for these assessments in relevant game margins: Adelaide have lost 2 games by less than 2 goals, while the Roos have lost 4 games and the Saints 3 games by less than 3 goals.