When the Low Scorer Wins

One aspect of the unusual predictability of this year's AFL results has gone - at least to my knowledge - unremarked.

That aspect is the extent to which the week's low-scoring team has been the team receiving the most points start on Sportsbet. Following this strategy would have been successful in six of the last eight rounds, albeit that in one of those rounds there were joint low-scorers and, in another, there were two teams both receiving the most start.

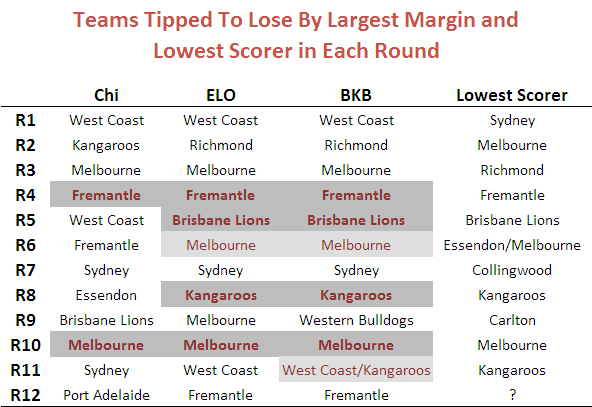
The table below provides the detail and also shows the teams that Chi and ELO would have predicted as the low scorers (proxied by the team they selected to lose by the biggest margin). Correct predictions are shaded dark grey. "Half right" predictions - where there's a joint prediction, one of which is correct, or a joint low-scorer, one of which was predicted - are shaded light grey.

Lowest Scorer.png

To put the BKB performance in context, here's the data for seasons 2006 to 2009.

Low Scorer History.png

All of which might appear to amount to not much until you understand that Sportsbet fields a market on the round's lowest scorer. So we should keep an eye on this phenomenon in subsequent weeks to see if the apparent lift in the predictability of the low scorer is a statistical anomaly or something more permanent and exploitable. In fact, there might still be a market opportunity even if historical rates of predictiveness prevail, provided the average payoff is high enough.

Losing Does Lead to Winning But Only for Home Teams (and only sometimes)

For reasons that aren't even evident to me, I decided to revisit the issue of "when losing leads to winning", which I looked at a few blogs back.

In that earlier piece no distinction was made between which team - home or away - was doing the losing or the winning. Such a distinction, it turns out, is important in uncovering evidence for the phenomenon in question.

Put simply, there is some statistical evidence across the home-and-away matches from 1980 to 2008 that home teams that trail by between 1 and 4 points at quarter time, or by 1 point at three-quarter time, tend to win more often than they lose. There is no such statistical evidence for away teams.

The table below shows the proportion of times that the home team has won when leading or trailing by the amount shown at quarter time, half time or three-quarter time.

Home_Team_Wins_By_Lead_Short.png

It shows, for example, that home teams that trailed by exactly 5 points at quarter time went on to win 52.5% of such games.

Using standard statistical techniques I've been able to determine, based on the percentages in the table and the number of games underpinning each percentage, how likely it is that the "true" proportion of wins by the home team is greater than 50% for any of the entries in the table for which the home team trails. That analysis, for example, tells us that we can be 99% confident (since the significance level is 1%) that the figure of 57.2% for teams trailing by 4 points at quarter time is statistically above 50%.

(To look for a losing leads to winning phenomenon amongst away teams I've performed a similar analysis on the rows where the home team is ahead and tested whether the proportion of wins by the home team is statistically significantly less than 50%. None of the entries was found to be significant.)

My conclusion then is that, in AFL, it's less likely that being slightly behind is motivational. Instead, it's that the home ground advantage is sufficient for the home team to overcome small quarter time or three-quarter time deficits. It's important to make one other point: though home teams trailing do, in some cases, win more often that they lose, they do so at a rate less than their overall winning rate, which is about 58.5%.

So far we've looked only at narrow leads and small deficits. While we're here and looking at the data in this way, let's broaden the view to consider all leads and deficits.

Home_Team_Wins_By_Lead_Long.png

In this table I've grouped leads and deficits into 5-point bands. This serves to iron out some of the bumps we saw in the earlier, more granular table.

A few things strike me about this table:

  • Home teams can expect to overcome a small quarter time deficit more often than not and need only be level at the half or at three-quarter time in order to have better than even chances of winning. That said, even the smallest of leads for the away team at three-quarter time is enough to shift the away team's chances of victory to about 55%.
  • Apparently small differences have significant implications for the outcome. A late goal in the third term to extend a lead from say 4 to 10 points lifts a team's chances - all else being equal - by 10% points if it's the home team (ie from 64% to 74%) and by an astonishing 16% points if it's the away team (ie from 64% to 80%).
  • A home team that leads by about 2 goals at the half can expect to win 8 times out of 10. An away team with such a lead with a similar lead can expect to win about 7 times out of 10.

From One Year To The Next: Part 2

Last blog I promised that I'd take another look at teams' year-to-year changes in ladder position, this time taking a longer historical perspective.

For this purpose I've elected to use the period 1925 to 2008 as there have always been at least 10 teams in the competition from that point onwards. Once again in this analysis I've used each team's final ladder position, not their ladder position as at the end of the home and away season. Where a team has left or joined the competition in a particular season, I've omitted its result for the season in which it came (since there's no previous season) or went (since there's no next season).

As the number of teams making the finals has varied across the period we're considering, I'll not be drawing any conclusions about the rates of teams making or missing the finals. I will, however, be commenting on Grand Final participation as each season since 1925 has culminated in such an event.

Here's the raw data:

Ladder_Change_Val_25_08.png

(Note that I've grouped all ladder positions of 9th or lower in the "9+" category. In some years this incorporates just two ladder positions, in others as many as eight.)

A few things are of note in this table:

  • Losing Grand Finalists are more likely than winning Grand Finalists to win in the next season.
  • Only 10 of 83 winning Grand Finalists finished 6th or lower in the previous season.
  • Only 9 of 83 winning Grand Finalists have finished 7th or lower in the subsequent season.
  • The average ladder position of a team next season is highly correlated with its position in the previous season. One notable exception to this tendency is for teams finishing 4th. Over one quarter of such teams have finished 9th or worse in the subsequent season, which drags their average ladder position in the subsequent year to 5.8, below that of teams finishing 5th.
  • Only 2 teams have come from 9th or worse to win the subsequent flag - Adelaide, who won in 1997 after finishing 12th in 1996; and Geelong, who won in 2007 after finishing 10th in 2006.
  • Teams that finish 5th have a 14-3 record in Grand Finals that they've made in the following season. In percentage terms this is the best record for any ladder position.

Here's the same data converted into row percentages.

Ladder_Change_PC_25_08.png

Looking at the data in this way makes a few other features a little more prominent:

  • Winning Grand Finalists have about a 45% probability of making the Grand Final in the subsequent season and a little under a 50% chance of winning it if they do.
  • Losing Grand Finalists also have about a 45% probability of making the Grand Final in the subsequent season, but they have a better than 60% record of winning when they do.
  • Teams that finish 3rd have about a 30% chance of making the Grand Final in the subsequent year. They're most likely to be losing Grand Finalists in the next season.
  • Teams that finish 4th have about a 16% chance of making the Grand Final in the subsequent year. They're most likely to finish 5th or below 8th. Only about 1 in 4 improve their ladder position in the ensuing season.
  • Teams that finish 5th have about a 20% chance of making the Grand Final in the subsequent year. These teams tend to the extremes: about 1 in 6 win the flag and 1 in 5 drops to 9th or worse. Overall, there's a slight tendency for these teams to drop down the ladder.
  • Teams that finish 6th or 7th have about a 20% chance of making the Grand Final in the subsequent year. Teams finishing 6th tend to drop down the ladder in the next season; teams finishing 7th tend to climb.
  • Teams that finish 8th have about a 8.5% chance of making the Grand Final in the subsequent year. These teams tend to climb in the ensuing season.
  • Teams that finish 9th or worse have about a 3.5% chance of making the Grand Final in the subsequent year. They also have a roughly 2 in 3 chance of finishing 9th or worse again.

So, I suppose, relatively good news for Cats fans and perhaps surprisingly bad news for St Kilda fans. Still, they're only statistics.

From One Year To The Next: Part 1

With Carlton and Essendon currently sitting in the top 8, I got to wondering about the history of teams missing the finals in one year and then making it the next. For this first analysis it made sense to choose the period 1997 to 2008 as this is the time during which we've had the same 16 teams as we do now.

For that period, as it turns out, the chances are about 1 in 3 that a team finishing 9th or worse in one year will make the finals in the subsequent year. Generally, as you'd expect, the chances improve the higher up the ladder that the team finished in the preceding season, with teams finishing 11th or higher having about a 50% chance of making the finals in the subsequent year.

Here's the data I've been using for the analysis so far:

Ladder_Change_Val_97_08.png

And here's that same data converted into row percentages and grouping the Following Year ladder positions.

Ladder_Change_PC_97_08.png

Note that in these tables I've used each team's final ladder position, not their ladder position as at the end of the home and away season. So, for example, Geelong's 2008 ladder position would be 2nd, not 1st.

Teams that make the finals in a given year have about a 2 in 3 chance of making the finals in the following year. Again, this probability tends to increase with higher ladder position: teams finishing in the top 4 places have a better than 3 in 4 record for making the subsequent year's finals.

One of the startling features of these tables is just how much better flag winners perform in subsequent years than do teams from any other position. In the first table, under the column headed "Ave" I've shown the average next-season finishing position of teams finishing in any given position. So, for example, teams that win the flag, on average, finish in position 3.5 on the subsequent year's ladder. This average is bolstered by the fact that 3 of the 11 (or 27%) premiers have gone back-to-back and 4 more (another 36%) have been losing Grand Finalists. Almost 75% have finished in the top 4 in the subsequent season.

Dropping down one row we find that the losing Grand Finalist from one season fares much worse in the next season. Their average ladder position is 6.6, which is over 3 ladder spots lower than the average for the winning Grand Finalist. Indeed, 4 of the teams that finished 2nd in one season missed the finals in the subsequent year. This is true of only 1 winning Grand Finalist.

In fact, the losing Grand Finalists don't tend to fare any better than the losing Preliminary Finalists, who average positions 6.0 (3rd) and 6.8 (4th).

The next natural grouping of teams based on average ladder position in the subsequent year seems to be those finishing 5th through 11th. Within this group the outliers are teams finishing 6th (who've tended to drop 3.5 places in the next season) and teams finishing 9th (who've tended to climb 1.5 places).

The final natural grouping includes the remaining positions 12th through 16th. Note that, despite the lowly average next-year ladder positions for these teams, almost 15% have made the top 4 in the subsequent year.

A few points of interest on the first table before I finish:

  • Only one team that's finished below 6th in one year has won the flag in the next season: Geelong, who finished 10th in 2006 and then won the flag in 2007
  • The largest season-to-season decline for a premier is Adelaide's fall from the 1998 flag to 13th spot in 1999.
  • The largest ladder climb to make a Grand Final is Melbourne's rise from 14th in 1999 to become losing Grand Finalists to Essendon in 2000.

Next time we'll look at a longer period of history.

Does Losing Lead to Winning?

I was reading an issue of Chance News last night and came across the article When Losing Leads to Winning. In short, the authors of this journal article found that, in 6,300 or so most recent NCAA basketball games, teams that trailed by 1 point at half-time went on to win more games than they lost. This they attribute to "the motivational effects of being slightly behind".

Naturally, I wondered if the same effect existed for footy.

This first chart looks across the entire history of the VFL/AFL.

Leads and Winning - All Seasons.png

The red line charts the percentage of times that a team leading by a given margin at quarter time went on to win the game. You can see that, even at the leftmost extremity of this line, the proportion of victories is above 50%. So, in short, teams with any lead at quarter time have tended to win more than they've lost, and the larger the lead generally the greater proportion they've won. (Note that I've only shown leads from 1 to 40 points.)

Next, the green line charts the same phenomenon but does so instead for half-time leads. It shows the same overall trend but is consistently above the red line reflecting the fact that a lead at half-time is more likely to result in victory than is a lead of the same magnitude at quarter time. Being ahead is important; being ahead later in the game is more so.

Finally, the purple line charts the data for leads at three-quarter time. Once again we find that a given lead at three-quarter time is generally more likely to lead to victory than a similar lead at half-time, though the percentage point difference between the half-time and three-quarter lines is much less than that between the half-time and first quarter lines.

For me, one of the striking features of this chart is how steeply each line rises. A three-goal lead at quarter time has, historically, been enough to win around 75% of games, as has a two-goal lead at half-time or three-quarter time.

Anyway, there's no evidence of losing leading to winning if we consider the entire history of footy. What then if we look only at the period 1980 to 2008 inclusive?

Leads and Winning - 1980 to 2008.png

Now we have some barely significant evidence for a losing leads to winning hypothesis, but only for those teams losing by a point at quarter time (where the red line dips below 50%). Of the 235 teams that have trailed by one point at quarter time, 128 of them or 54.5% have gone on to win. If the true proportion is 50%, the likelihood of obtaining by chance a result of 128 or more wins is about 8.5%, so a statistician would deem that "significant" only if his or her preference was for critical values of 10% rather than the more standard 5%.

There is certainly no evidence for a losing leads to winning effect with respect to half-time or three-quarter time leads.

Before I created this second chart my inkling was that, with the trend to larger scores, larger leads would have been less readily defended, but the chart suggests otherwise. Again we find that a three-goal quarter time lead or a two-goal half-time or three-quarter time lead is good enough to win about 75% of matches.

Not content to abandon my preconception without a fight, I wondered if the period 1980 to 2008 was a little long and that my inkling was specific to more recent seasons. So, I divided up the 112-season history in 8 equal 14-year epochs and created the following table.

Leads and Winning - Table.png

The top block summarises the fates of teams with varying lead sizes, grouped into 5-point bands, across the 8 epochs. For example, teams that led by 1 to 5 points in any game played in the 1897 to 1910 period went on to win 55% of these games. Looking across the row you can see that this proportion has varied little across epochs never straying by more than about 3 percentage points from the all-season average of 54%.

There is some evidence in this first block that teams in the most-recent epoch have been better - not, as I thought, worse - at defending quarter time leads of three goals or more, but the evidence is slight.

Looking next at the second block there's some evidence of the converse - that is, that teams in the most-recent epoch have been poorer at defending leads, especially leads of a goal or more if you adjust for the distorting effect on the all-season average of the first two epochs (during which, for example, a four-goal lead at half-time should have been enough to send the fans to the exits).

In the third and final block there's a little more evidence of recent difficulty in defending leads, but this time it only relates to leads less than two goals at the final change.

All in all I'd have to admit that the evidence for a significant decline in the ability of teams to defend leads is not particularly compelling. Which, of course, is why I build models to predict football results rather than rely on my own inklings ...

Pointless v St Kilda

The Swans' 2nd and 3rd quarter performances last Saturday should not go unremarked.

In the 3rd quarter they failed to register a point, which is a phenomenon that's occurred in only 1.2% of all quarters ever played and in just 0.3% of quarters played since and including the 1980 season. Indeed, so rare is it that only one occurrence has been recorded in each of the last two seasons.

Last year, Melbourne racked up the season's duck egg in the 1st quarter of their Round 19 clash against Geelong, leaving them trailing 0.0 to 8.5 at the first change and in so doing setting a new standard for rapidity in disillusioning Heritage Fund Investors. In 2007 the Western Bulldogs were the team who failed to trouble the goal umpire for an entire quarter - the 2nd quarter of their Round 22 game against the Kangaroos.

So, let's firstly salute the rarity that is failing to score for an entire quarter.

But the Swans did more than this. They preceded their scoreless quarter with a quarter in which they kicked just two behinds. Stringing together successive quarters that, combined, yield two points or fewer is a feat that's been achieved only 175 times in the entire history of the game, and 140 of those were recorded in the period from 1897 to 1918.

Across the last 30 seasons only 12 teams have managed such frugality in front of goal. Prior to the Swans, the most recent example was back in Round 14 of 2002 when West Coast went in at half-time against Geelong having scored 4.7 and headed to the sheds a bit over an hour later having scored just two behinds in the 3rd quarter and nothing at all in the 4th. That makes it almost 6-and-a-half seasons since anyone has done what the Swans did on Saturday.

Prior to the Eagles we need to reach back to Round 4 of 1999 when Essendon - playing West Coast as it happens - finished the 1st quarter and the half stuck at 2.2 and then managed just two behinds in the 3rd term. (They went on to record only two more scoring shots in the final term but rather spoiled things by making one of them a major.)

If you saw the Swans games then, you witnessed a little piece of history.

Marginally Interesting

Here are a handful of facts on AFL margins:

  • The largest ever victory margin was 190 points (Fitzroy over Melbourne in 1979)
  • Every margin between 0 and 150 points has been achieved at least once except margins of 136, 144, 145, 148 and 149 points.
  • Last season, no game finished with a victory margin of 25 points
  • No game finished with a margin of 47 points in the previous 2 seasons
  • No game finished with a margin of 67 points in the previous 5 seasons
  • No game finished with a margin of 90, 94 or 98 points in the previous 8 seasons
  • No game finished with a margin of 109 points in the previous 12 seasons
  • No game finished with a margin of 120 points in the previous 17 seasons
  • No game finished with a margin of 128 points in the previous 39 seasons
  • No game finished with a margin of 161 points in the previous 109 seasons
  • At least one game has finished with a margin of 6 points in each of the previous 48 seasons
  • At least one game has finished with a margin of 26 points in each of the previous 42 seasons

Limning the Ladder

It's time to consider the grand sweep of football history once again.

This time I'm looking at the teams' finishing positions, in particular the number and proportion of times that they've each finished as Premiers, Wooden Spooners, Grand Finalists and Finalists, or that they've finished in the Top Quarter or Top Half of the draw.

Here's a table providing the All-Time data.

Teams_All_Time.png

Note that the percentage columns are all as a percentage of opportunities. So, for a season to be included in the denominator for a team's percentage, that team needs to have played in that season and, in the case of the Grand Finalists and Finalists statistics, there needs to have been a Grand Final (which there wasn't in 1897 or 1924) or there needs to have been Finals (which, effectively, there weren't in 1898, 1899 or 1900).

Looking firstly at Premierships, in pure number terms Essendon and Carlton tie for the lead on 16, but Essendon missed the 1916 and 1917 seasons and so have the outright lead in terms of percentage. A Premiership for West Coast in any of the next 5 seasons (and none for the Dons) would see them overtake Essendon on this measure.

Moving then to Spoons, St Kilda's title of the Team Most Spooned looks safe for at least another half century as they sit 13 clear of the field, and University will surely never relinquish the less euphonius but at least equally as impressive title of the Team With the Greatest Percentage of Spooned Seasons. Adelaide, Port Adelaide and West Coast are the only teams yet to register a Spoon (once the Roos' record is merged with North Melbourne's).

Turning next to Grand Finals we find that Collingwood have participated in a remarkable 39 of them, which equates to a better than one season in three record and is almost 10 percentage points better than any other team. West Coast, in just 22 seasons, have played in as many Grand Finals as have St Kilda, though St Kilda have had an additional 81 opportunities.

The Pies also lead in terms of the number of seasons in which they've participated in the Finals, though West Coast heads them in terms of percentages for this same statistic, having missed the Finals less than one season in four across the span of their existence.

Finally, looking at finishing in the Top Half or Top Quarter of the draw we find the Pies leading on both of these measures in terms of number of seasons but finishing runner-up to the Eagles in terms of percentages.

The picture is quite different if we look just at the 1980 to 2008 period, the numbers for which appear below.

Teams_80_08.png

Hawthorn now dominates the Premiership, Grand Finalist and finishing in the Top Quarter statistics. St Kilda still own the Spoon market and the Dons lead in terms of being a Finalist most often and finishing in the Top Half of the draw most often.

West Coast is the team with the highest percentage of Finals appearances and highest percentage of times finishing in the Top Half of the draw.

Percentage of Points Scored in a Game

We statisticians spend a lot of our lives dealing with the bell-shaped statistical distribution known as the Normal or Gaussian distribution. It describes a variety of phenomena in areas as diverse as physics, biology, psychology and economics and is quite frankly the 'go-to' distribution for many statistical purposes.

So, it's nice to finally find a footy phenomenon that looks Normally distributed.

The statistic is the percentage of points scored by each team is a game and the distribution of this statistic is shown for the periods 1897 to 2008 and 1980 to 2008 in the diagram below.

Percent_of_Points_Scored.png

Both distributions follow a Normal distribution quite well except in two regards:

  1. They fall off to zero in the "tails" faster than they should. In other words, there are fewer games with extreme results such as Team A scoring 95% of the points and Team B only 5% than would be the case if the distribution were strictly normal.
  2. There's a "spike" around 50% (ie for very close and drawn games) suggesting that, when games are close, the respective teams play in such a way as to preserve the narrowness of the margin - protecting a lead rather than trying to score more points when narrowly in front and going all out for points when narrowly behind.

Knowledge of this fact is unlikely to make you wealthy but it does tell us that we should expect approximately:

  • About 1 game in 3 to finish with one team scoring about 55% or more of the points in the game
  • About 1 game in 4 to finish with one team scoring about 58% or more of the points in the game
  • About 1 game in 10 to finish with one team scoring about 65% or more of the points in the game
  • About 1 game in 20 to finish with one team scoring about 70% or more of the points in the game
  • About 1 game in 100 to finish with one team scoring about 78% or more of the points in the game
  • About 1 game in 1,000 to finish with one team scoring about 90% or more of the points in the game

The most recent occurrence of a team scoring about 90% of the points in a game was back in Round 15 of 1989 when Essendon 25.10 (160) defeated West Coast 1.12 (18).

We're overdue for another game with this sort of lopsided result.

Less Than A Goal In It

Last year, 20 games in the home and away season were decided by less than a goal and two teams, Richmond and Sydney were each involved in 5 of them.

Relatively speaking, the Tigers and the Swans fared quite well in these close finishes, each winning three, drawing one and losing just one of the five contests.

Fremantle, on the other hand, had a particularly bad run in close games last years, losing all four of those it played in, which contributed to an altogether forgettable year for the Dockers.

The table below shows each team's record in close games across the previous five seasons.

Close Finishes.png

Surprisingly, perhaps, the Saints head the table with a 71% success rate in close finishes across the period 2004-2008. They've done no worse than 50% in close finishes in any of the previous five seasons, during which they've made three finals appearances.

Next best is West Coast on 69%, a figure that would have been higher but for an 0 and 1 performance last year, which was also the only season in the previous five during which they missed the finals.

Richmond have the next best record, despite missing the finals in all five seasons. They're also the team that has participated in the greatest number of close finishes, racking up 16 in all, one ahead of Sydney, and two ahead of Port.

The foot of the table is occupied by Adelaide, whose 3 and 9 record includes no season with a better than 50% performance. Nonetheless they've made the finals in four of the five years.

Above Adelaide are the Hawks with a 3 and 6 record, though they are 3 and 1 for seasons 2006-2008, which also happen to be the three seasons in which they've made the finals.

So, from what we've seen already, there seems to be some relationship between winning the close games and participating in September's festivities. The last two rows of the table shed some light on this issue and show us that Finalists have a 58% record in close finishes whereas Non-Finalists have only a 41% record.

At first, that 58% figure seems a little low. After all, we know that the teams we're considering are Finalists, so they should as a group win well over 50% of their matches. Indeed, over the five year period they won about 65% of their matches. It seems then that Finalists fare relatively badly in close games compared to their overall record.

However, some of those close finishes must be between teams that both finished in the finals, and the percentage for these games is by necessity 50% (since there's a winner and a loser in each game, or two teams with draws). In fact, of the 69 close finishes in which Finalists appeared, 29 of them were Finalist v Finalist matchups.

When we look instead at those close finishes that pitted a Finalist against a Non-Finalist we find that there were 40 such clashes and that the Finalist prevailed in about 70% of them.

So that all seems as it should be.

Teams' Performances Revisited

In a comment on the previous posting, Mitch asked if we could take a look at each team's performance by era, his interest sparked by the strong all-time performance of the Blues and his recollection of their less than stellar recent seasons.

Here's the data:

All_Time_WDL_by_Epoch.png

So, as you can see, Carlton's performance in the most recent epoch is significantly below its all-time performance. In fact, the 1993-2008 epoch is the only one in which the Blues failed to return a better than 50% performance.

Collingwood, the only team with a better lifetime record than Carlton, have also had a well below par last epoch during which they too have registered their first sub-50% performance, continuing a downward trend which started back in Epoch 2.

Six current teams have performed significantly better in the 1993-2008 epoch than their all-time performance: Geelong (who registered their best ever epoch), Sydney (who cracked 50% for the first time in four epochs), Brisbane (who could hardly but improve), the Western Bulldogs (who are still yet to break 50% for an epoch, their 1945-1960 figure being actually 49.5%), North Melbourne (who also registered their best ever epoch),  and St Kilda (who still didn't manage 50% for the epoch, a feat they've achieved only once).

Just before we wind up I should note that the 0% for University in Epoch 2 is not an error. It's the consequence of two 0 and 18 performances by Uni in 1913 and 1914 which, given that these followed directly after successive 1 and 17 performances in 1911 and 1912, unsurprisingly heralded the club's demise. Given that Uni's sole triumph of 1912 came in the third round, by my calculations that means University lost its final 51 matches.

Teams' All-Time Records

At this time of year, before we fixate on the week-to-week triumphs and travesties of yet another AFL season, it's interesting to look at the varying fortunes of all the teams that have ever competed in the VFL/AFL.

The table below provides the Win, Draw and Loss records of every team.

All_Time_WDL.png

As you can see, Collingwood has the best record of all the teams having won almost 61% of all the games in which it has played, a full 1 percentage point better than Carlton, in second. Collingwood have also played more games than any other team and will be the first team to have played in 2,300 games when Round 5 rolls around this year.

Amongst the relative newcomers to the competition, West Coast and Port Adelaide - and to a lesser extent, Adelaide - have all performed well having won considerably more than half of their matches.

Sticking with newcomers but dipping down to the other end of the table we find Fremantle with a particularly poor record. They've won just under 40% of their games and, remarkably, have yet to register a draw. (Amongst current teams, Essendon have recorded the highest proportion of drawn games at 1.43%, narrowly ahead of Port Adelaide with 1.42%. After Fremantle, the team with the next lowest proportion of drawn games is Adelaide at 0.24%. In all, 1.05% of games have finished with scores tied.)

Lower still we find the Saints, a further 1.3 percentage points behind Fremantle. It took St Kilda 48 games before it registered its first win in the competition, which should surely have been some sort of a hint to fans of the pain that was to follow across two world wars and a depression (maybe two). Amongst those 112 seasons of pain there's been just the sole anaesthetising flag, in 1966.

Here then are a couple of milestones that we might witness this year that will almost certainly go unnoticed elsewhere:

  • Collingwood's 2,300th game (and 1,400th win or, if the season's a bad one for them, 900th loss)
  • Carlton's 900th loss
  • West Coast's 300th win
  • Port Adelaide's 300th game
  • Geelong's and Sydney's 2,200th game
  • Adelaide's 200th loss
  • Richmond's 1,000th loss (if they fail to win more than one match all season)
  • Fremantle's 200th loss

Granted, few of those are truly banner events, but if AFL commentators were as well supported by statisticians as, say, Major League Baseball, you can bet they'd get a mention, much as equally arcane statistics are sprinkled liberally in the 3 hours of dead time there is between pitches.

Which Quarter Do Winners Win?

Today we'll revisit yet another chestnut and we'll analyse a completely new statistic.

First, the chestnut: which quarter do winning teams win most often? You might recall that for the previous four seasons the answer has been the 3rd quarter, although it was a very close run thing last season, when the results for the 3rd and 4th quarters were nearly identical.

How then does the picture look if we go back across the entire history of the VFL/AFL?

Qtrs_Won_By_Winners.png

It turns out that the most recent epoch, spanning the seasons 1993 to 2008, has been one in which winning teams have tended to win more 3rd quarters than any other quarter. In fact, it was the quarter won most often in nine of those 16 seasons.

This, however, has not at all been the norm. In four of the other six epochs it has been the 4th quarter that winning teams have tended to win most often. In the other three epochs the 4th quarter has been the second most commonly won quarter.

But, the 3rd quarter has rarely been far behind the 4th, and its resurgence in the most recent epoch has left it narrowly in second place in the all-time statistics.

A couple of other points are worth making about the table above. Firstly, it's interesting to note how significantly more frequently winning teams are winning the 1st quarter than they have tended to in epochs past. Successful teams nowadays must perform from the first bounce.

Secondly, there's a clear trend over the past 4 epochs for winning teams to win a larger proportion of all quarters, from about 66% in the 1945 to 1960 epoch to almost 71% in the 1993 to 2008 epoch.

Now on to something a little different. While I was conducted the previous analysis, I got to wondering if there'd ever been a team that had won a match in which in had scored more points than its opponent in just a solitary quarter. Incredibly, I found that it's a far more common occurrence than I'd have estimated.

Number_Of_Qtrs_Won_By_Winners.png

The red line shows, for every season, the percentage of games in which the winner won just a solitary quarter (they might or might not have drawn any of the others). The average percentage across all 112 seasons is 3.8%. There were five such games last season, in four of which the winner didn't even manage to draw any of the other three quarters. One of these games was the Round 19 clash between Sydney and Fremantle in which Sydney lost the 1st, 2nd and 4th quarters but still got home by 2 points on the strength of a 6.2 to 2.5 3rd term.

You can also see from the chart the upward trend since about the mid 1930s in the percentage of games in which the winner wins all four quarters, which is consistent with the general rise, albeit much less steadily, in average victory margins over that same period that we saw in an earlier blog.

To finish, here's the same data from the chart above summarised by epoch:

Number_Of_Qtrs_Won_By_Winners_Table.png

How Important is Pre-Season Success?

With the pre-season now underway it's only right that I revisit the topic of the extent to which pre-season performance predicts regular season success.

Here's the table with the relevant data:

Pre-Season.png

The macro view tells us that, of the 21 pre-season winners, only 14 of them have gone on to participate in the regular season finals in the same year and, of the 21 pre-season runners-up, only 12 of them have made that same category. When you consider that roughly one-half of the teams have made the regular season finals in each year - slightly less from 1988 to 1993, and slightly more in 1994 - those stats look fairly unimpressive.

But a closer, team-by-team view shows that Carlton alone can be blamed for 3 of the 7 occasions on which the pre-season winner has missed the regular season finals, and Adelaide and Richmond can be blamed for 4 of the 9 occasions on which the pre-season runner-up has missed the regular season finals.

Pre-Season_Team.png

So, unless you're a Crows, Blues or Tigers supporter, you should be at least a smidge joyous if your team makes the pre-season final; if history's any guide, the chances are good that your team will get a ticket to the ball in September.

It's one thing to get a ticket but another thing entirely to steal the show. Pre-season finalists can, collectively, lay claim to five flags but, as a closer inspection of the previous table will reveal, four of these flags have come from just two teams, Essendon and Hawthorn. What's more, no flag has come to a pre-season finalist since the Lions managed it in 2001.

On balance then, I reckon I'd rather the team that I supported remembered that there's a "pre" in pre-season.

A Little AFL/VFL History

Every so often this year I'll be diving into the history of the VFL/AFL to come up with obscure and conversation-stopping facts for you to use at the next social event you attend.

For example, do you know the most common score in AFL history? It's 12.12 (84) and has been a team's final score about 0.88% of the time (counting two scores for each game in the denominator for that percentage). What if we restrict our attention to more recent seasons, say 1980 to 2008? It's 12.12 again (84), only now its prevalence is 0.98%. Last year though we managed only a single 12.12 (84) score, courtesy of St Kilda in Round 14.

While we're on the topic of scores, which season do you think produced the highest average score per team? It was 1982 and the average was 112.07 points. The trend since that season has been steadily downwards with the nadir being in 1997 when the average was 90.37 points.

Average_Team_Scores.png

From season averages to individual game scores, here are a couple of doozies. In May of 1919, Geelong took on St Kilda in a Round 5 clash at Corio Oval. The first quarter failed to produce a goal from either team and saw Geelong lead 0.6 to 0.2. St Kilda found their range - relatively speaking - in the second quarter to lead 3.4 to 0.9 at the main break. One need speculate only briefly about the thrust of the Cats' half-time speech from the coach.

The speech clearly didn't help, however, as Geelong continued to accumulate only singles for the remaining two quarters, finally emerging goal-less and defeated, 0.18 to 6.10.

Just over two years later, in July of 1921, St Kilda swapped roles and matched the Cats' ineptitude, eventually going down 0.18 to Fitzroy's 6.8 in front of around 6,000 startled fans.

If you're looking for more sustained inaccuracy you'd be after the South Melbourne team of 1900. They managed 59.127 for the entire season, a 31.7% accuracy rate.

In contrast, in 1949 the Hawks put on a spectacular display of straight kicking at Glenferrie Oval, finishing with 7.0 for the game. Regretably, their opponents, Essendon, clearly with no sense of aesthetics, repeatedly sprayed the ball at goal finishing 70 point victors by bagging a woefully inaccurate 16.16.

Again, turning from the single game to an entire season, plaudits must go to the St Kilda team of 2004, who registered 409.253 or 61.8% for the season. But, as the Hawks discovered, accuracy does not preordain success: St Kilda went out in the Preliminary Final to Port by 6 points.