Simulating the Finalists for 2013 : Post Round 22

What a strange and intriguing time it is to be following - and trying to predict - AFL football. As I write this, just three days from the start of the final home-and-away series of games, and just one week more distant from the Finals, there's still no complete resolution of the Essendon debacle and no definitive statement about whether they will or will not play in those Finals.
Read More

Simulated Performance of Head-to-Head Algorithm vs TAB Bookmaker

In the previous blog I reported that:

the TAB Bookmaker can be thought of as a Bookmaker with zero bias and a 5-5.5% sigma, and the Head-to-Head Probability Predictor can be thought of as a Punter with a +1-2% bias and a 10-12% sigma

Simulating these parameter ranges, with an LPSO-like Bookmaker and with his overround varying in the range 5% to 6.5%, reveals that the return to Kelly-staking for a Punter with Bias and Sigma in these ranges (who, unlike MAFL's Head-to-Head Fund, wagers on Away as well as Home teams) is positively related to Bookmaker Sigma ...

(Note that if Bookmaker Sigma is around 5% the expected return to Kelly-staking is negative.)

The Punter's ROI is negatively related to his Sigma ...

... and pretty much unrelated to his Bias.

These relationships are all similar to what we found in earlier blogs in which the parameter space investigated was much larger.

What's also interesting is that the variability of the returns to Kelly-staking is positively related to Bookmaker Sigma, broadly unrelated to Punter Sigma, and negatively related to Punter Bias.

(Note that these images can be clicked for larger versions.)


We also find that, for every set of parameters in the simulation, the expected return to Kelly-staking exceeds that for Level-staking, which is broadly consistent with what we found when exploring the larger parameter space, but the correlation between the average Log Probability Score and the ROI to Kelly-staking is, in absolute terms, always lower than the correlation between the average Brier Score and the ROI to Kelly-staking, which is contrary to what we found when exploring the larger scenario space.

Using RWeka to create simple rules for when to Kelly-stake and when to beat a considered retreat from wagering, the first few rules we're offered are:

  • If the Total Overround is less than 5.88% and the Bookmaker Sigma exceeds 5.24%, then the best strategy is to Kelly-stake, otherwise
  • If the Total Overround is less than 5.63% and the Punter Sigma is less than 11.00%, then the best strategy is, again, to Kelly-stake, otherwise
  • If the Total Overround is greater than 6.18% and the Bookmaker Sigma is less than 5.27%, then the best strategy is not to bet, otherwise
  • If the Total Overround is greater than 5.34%, the Punter Sigma is less than 10.73%, and the Bookmaker Sigma exceeds 5.14%, then the best strategy is to Kelly-stake, otherwise
  • If the Total Overround is less than 5.44%, then the best strategy is to Kelly-stake

For about 70% of the remaining scenarios the recommendation is not to bet.

Using Eureqa's Formulize to build a model of the ROI to Kelly-staking, we find that one of the best-fitting models, with an R-squared in excess of 85%, is:

  • Expected Kelly ROI = 2.143*Bookie Sigma - Bookie Total Overround - Bookie Sigma*Punter Bias - 0.463*Punter Sigma

This suggests that, as we've found previously, the ROI to Kelly-staking is heavily dependent on the Bookmaker's precision and, to a lesser extent, on the Punter's. As well, the ROI to Kelly-staking drops percent-for-percent with the Bookmaker's Total Overround.

And, finally, using Eureqa's Formulize to build a model of the standard deviation of the ROI to Kelly-staking, we find that one of the best-fitting models, but with an R-squared of only around 16%, is:

  • Expected SD Kelly ROI = 0.067 + 0.415*Bookie Sigma - 3.600*Punter Bias*Bookie Total Overround

So, not only does the expected return to Kelly-staking rise with the Bookmaker's Sigma, so too does the variability of that return. In addition, variability falls with Punter Bias and with the Bookmaker's Total Overround.

SUMMARY

This blog addresses Bookmaker vs Punter scenarios that we are, based on empirical data for the TAB Bookmaker and MAFL's Head-to-Head Fund algorithm, most likely to encounter in practice, and shows that there is a fairly narrow range of scenarios - where Bookmaker Sigma is sufficiently high, and Bookmaker overround and Punter Sigma are sufficiently low - for which the expected profit to Kelly-staking is positive.

It also suggests that, within the range of parameter values explored, the variability to Kelly-staking grows with Bookmaker imprecision and shrinks with the product of Punter Bias and Bookmaker Overround.

Bookmaker vs Punter Simulations Revisited : Risk-Equalising and LPSO-Like Bookmakers

In 2011 I introduced the five-parameter model, which I used to simulate the contest between Bookmaker and Punter by making different assumptions about the relative precision and unbiasedness with which they estimated the Home team's victory probability. The fifth parameter in the model was the total overround embedded in team prices by the Bookmaker and, as was my custom at the time, I assumed that the Bookmaker levied this total overround equally on both teams. Now, I think differently.
Read More

2012 - Final Simulations : Week 2

We lost Geelong and the Roos in Week 1 of the Finals and MARS re-rated the six remaining teams, which leaves us (using the same model that we used for Week 1 of the Finals) with the following team-versus-team probability matrix.

Broadly, Hawthorn is expected to beat everyone else fairly handily, except Sydney, which they're expected to beat less convincingly but still beat nonetheless.

Using this probability matrix for 1 million simulations yields the following team-by-team Finals outcome probabilities:

Hawthorn are now estimated to win two-thirds of the time and to make the Grand Final almost 9 times in 10.

Sydney are rated about 4/1 chances for the Flag but are about even money to play in the GF.

The remaining teams are mostly there to mop up the residual probabilities, with none rated better than about 30/1 chances for the Flag and about 5/1 or longer chances to even make the Grand Final. Adelaide, despite finishing 2nd on the ladder in the home-and-away season, are now rated only about 32/1 Flag chances and 15/1 chances of even making the Grand Final.

Simulated Grand Final quinella probabilities appear in this next table. A Hawks v Swans matchup is rated by far the most likely pairing, with a probability approaching 60%.

The next most-likely pairings are Hawks v Pies and Hawks v Eagles, which carry probabilities in the 10-15% range, then Swans v Freo and Swans v Crows matchups, which carry probabilities of around 5%.

Only four other pairings are possible, none of which include the Hawks or the Swans, and none of which are assessed by the simulations as being greater than about 1% prospects.

Amongst these quinellas only the Hawthorn v Sydney pairing at $1.90 offers any value on the TAB AFL Futures market. This wager is assessed as having a 14% edge.

Other TAB AFL Futures market wagers with a positive expectation this week are the Hawks to win the Flag at $1.65 (10% edge), the Hawks to play in the GF at $1.25 (7% edge), and the Swans to play in the GF at $1.55 (8% edge).

Adding these bets to those we've identified in AFL Futures markets in previous weeks yields the following picture:

As you can see, I've closed out those wagers whose fate has already been determined, the net return from which, it turns out, is marginally positive. The ROI from level-staking the identified opportunities is just over 1%.

Having locked in, last week, what look like very promising wagers on the Hawks and Swans at attractive prices on various AFL Futures markets, the current expectation must be for that ROI to grow.

At this point, however, all our eggs are very firmly in two baskets each, appropriately enough, avian based. We'll not know anything more about the fate of these wagers for at least another fortnight.


2012 - Final Simulations : Week 1

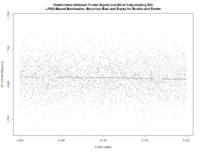
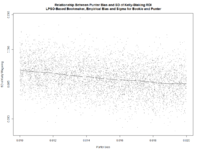
The first task for this week was to create a model to estimate the probability that one finalist should beat another using only the knowledge of which team was at home and the competing teams' MARS Ratings. Fitting a binary logistic to historical data produced the following model:

Prob(Home Team Wins) = logistic(0.446518 + 0.034125 * Home Team MARS Rating - 0.034161 * Away Team MARS Rating)

Applying that model to the most recent team MARS Ratings yields the following team-versus-team probability matrix:

(Note that, using the fitted model, the probability that Team A defeats Team B when Team A is at home is not the complement of the probability that Team B defeats Team A when Team B is at home.)

Based on the early head-to-head prices for the weekend's Finals, it would seem that MARS rates the chances of the Hawks, Swans and Roos more highly, or rates the chances of the Crows, Pies and Eagles less highly (or both) than does the TAB Bookmaker. It also appears to rate the Cats' and Freo's chances about the same as does the TAB Bookmaker.

Using this probability matrix to simulate the 2012 Finals series 1,000,000 times yields the following team-by-team probabilities:

Hawthorn then are clear Flag favourites, with Sydney on the 2nd line followed by the Pies, Cats and Crows. The Eagles, Freo and the Roos are all rated as rank outsiders to collect the Flag.

Comparing the probabilities in this table with the prices on offer at TAB Sportsbet suggests that the only wagers currently offering a positive expectation are for Hawthorn to win the Flag (28% edge) or to make the GF (11% edge), and for Sydney to win the Flag (5% edge) or to make the GF (24% edge). No other wagers on the Flag or Make the GF markets are worthwhile.

Turning next to potential GF pairings, the simulations yield the following.

Based on these simulated results the only TAB GF Quinella prices offering value are Hawthorn v Sydney at $5.50 (54% edge), Sydney v Geelong at $26 (40% edge), Hawthorn v Kangaroos at $67 (26% edge) and Geelong v Kangaroos at $501 (58% edge). No other pairing has a positive expectation.

The top half dozen most common simulated GF pairings combined represent around 80% of total probability, which means that the remaining 20 potential pairings amongst them account for only 20% of total probability.

(Note that there are only 26 possible GF pairings not 28, because two possible pairings, those reflecting the Elimination Finals, cannot occur in the GF.) 

As an interesting exercise, this week I decided to investigate the importance of teams' final ladder positions on their Finals aspirations. To do this I imagined that the teams in the top 8 had finished in a randomised order but with the same MARS' Ratings and hence probabilities of victory against any specified opponent.

I then simulated 1,000,000 Finals series, randomising the order for the top 8 teams for each simulation, and determined that, with randomised team order but with preserved team Ratings, the Flag probabilities would become Hawthorn 39% (down from 57%), Adelaide 6% (no change), Sydney 18% (no change), Collingwood 8% (no change), West Coast 8% (up from 2%), Geelong 13% (up from 8%), Fremantle 3% (up from 1%), and the Kangaroos 4% (up from 1%). Randomisation, it seems. serves mainly to redistribute probability from Hawthorn to the teams that finished in ladder positions 5 through 8.

The summary of this exercise if that, no matter where the Hawks had finished in the eight, on the basis of their MARS Rating superiority they'd still have been Flag favourites. Similarly, the Swans would have been 2nd-favourites regardless of their ladder finish, with Geelong, Collingwood, West Coast and Adelaide all forming the next tier of the market, Geelong foremost amongst them because of its superior MARS Rating. Not even randomisation of ladder finishes could substantially elevate the Flag potential of Fremantle and the Roos however.

2012 - Simulations After Round 21

Compared to the simulations at the end of Round 20, the latest simulations see: 

  • Adelaide's minor premiership chances plummet from 49% to under 5%. It's conceivable now, though barely, that they could finish at low as 6th.
  • Carlton's chances of making the finals rise from 13% to 35%
  • Collingwood's Top 4 chances drop from 94% to 80%, and its minor premiership chances virtually extinguished after having been assessed at about 11% last week
  • Essendon's chances of playing finals football dive from 26% to just over 1%
  • Fremantle's chances of competing in the finals rising from 43% to 62%
  • Geelong's Top 8 chances rise from 95% to 99%
  • The Gold Coast virtually handing the Wooden Spoon to GWS, the Suns' Spoon chances now rated at only just over 1%
  • GWS preparing its Spoon Acceptance speech
  • Hawthorn lifting its minor premiership chances from 16% to 49%. (Curiously, the Hawks are now more likely to finish 1st, 3rd or 4th than they are to finish 2nd.)
  • The Roos' Top 4 chances inch up from about 1% to just under 4%, and their chances of a Top 8 spot reach 100%
  • Richmond's Top 8 chances disappear (they were assessed at just over 2% last week)
  • St Kilda's Top 8 chances drop from 26% to under 3%
  • Sydney's minor premiership chances climb from 24% to 47%
  • West Coast's Top 4 chances rise from about 7% to 19% and their Top 8 chances reach 100%


To help you assess the validity of these latest simulations for yourself, here are the simulated probabilities for the results of each of the remaining 18 games in the home-and-away season, upon which the simulated ladder positions discussed above are based.

Turning to the TAB AFL Futures Markets and using the results of these latest simulations, only two wagers offer an edge of at least 5%: 

- Hawthorn for the minor premiership at $2.20 (estimated 7% edge)

- The Roos for a Top 4 finish at $34 (estimated 29% edge)


2012 - Simulations After Round 20

Here are the results of the new simulations, run using the updated competition ladder and the new MARS Ratings.

(The new results are in grey on the left, while those from last week are provided for comparative purposes and appear in green on the right.)

On a team-by-team basis the major changes are: 

  • Adelaide: now the favorites for the minor premiership, finishing top in almost 50% of simulations
  • Brisbane Lions: virtual certainties to finish somewhere within ladder positions 13 to 17
  • Carlton: increased their chances of making the 8 from about 7% to almost 13%
  • Collingwood: more than doubled their chances of winning the minor premiership from about 5% to 11%, and also boosted their chances of finishing in the Top 4 from 76% to 94%
  • Essendon: almost halved their chances of making the 8 from 47% to 26%
  • Fremantle: decreased their chances of making the 8 from 59% to 43%
  • Geelong: virtually eliminated their chances of a Top 4 finish, but left their finals chances only very slightly undiminished
  • Gold Coast: almost halved their Spoon chances from 26% to 15%
  • GWS: increased their Spoon chances from 74% to 85%
  • Hawthorn: saw their chances of finishing as minor premiers drop from 19% to 16%, but their chances of a Top 4 finish rise from 98% to 99%
  • Kangaroos: saw their chances of finishing in the Top 4 approximately halve from 2% to about 1%, but their chances of a Top 8 finish rise from 76% to 96%
  • Melbourne: did nothing to alter the inevitability of a finish somewhere from 13th to 17th 
  • Port Adelaide: also did nothing to alter the inevitability of a finish somewhere from 13th to 17th
  • Richmond: blew gently on their flickering chances of a Top 8 finish, nudging it from under 1% to just over 2%
  • St Kilda: lifted their finals chances from 21% to 26%
  • Sydney: more then halved their chances of taking out the minor premiership from 54% to 24%, and opened the probabilistic door, albeit only a hair's width, for a finish outside the Top 4
  • West Coast: saw their chances of a Top 4 finish slip from 10% to under 7%, but their chances of a spot in the finals rise from 93% to 99%
  • Western Bulldogs: did nothing to alter the inevitability of a finish somewhere from 13th to 17th

Marrying these new simulation results to the current TAB AFL Futures Markets we find value in: 

  • Hawthorn at $7 for the minor premiership (12% edge)
  • Carlton at $9 (13% edge) and Richmond at $51 (12% edge) for spots in the 8
  • Fremantle at $1.90 (8% edge) and St Kilda at $1.45 (8% edge) to miss the 8

The value we spotted last week in the prices for Geelong to make the 8, Collingwood and Geelong to make the Top 4, and in GWS to win the Spoon has now disappeared, leaving a wager on St Kilda to miss the 8 as the only identified "value bet" that still carries that label.