2022 : Simulating the Final Ladder After Round 12
/The latest simulations - both Standard and Heretical - suggest that the teams can be roughly grouped as followed:
Melbourne: virtually assured of a Top 4 finish and about a 2-in-5 chance to be Minor Premier
Geelong, Brisbane Lions, and Fremantle: 90%+ chance of playing Finals, 60% chance of a Top 4 finish and 1-in-7 to 1-in-8 chance of being Minor Premier
St Kilda, Sydney, and Carlton : 65-80% chance of playing Finals, 25-40% chance of a Top 4 finish, 5-7% chances for Minor Premiership
Richmond: 55-60% chance of playing Finals, 15-20% chance of a Top 4 finish, longshot for Minor Premiership
Collingwood, Gold Coast, and Western Bulldogs: 35-50% chance of playing Finals, 6-9% chance of a Top 4 finish, extreme longshots for Minor Premiership
Port Adelaide: 15-20% chance of playing Finals, longshots for a Top 4 finish
Adelaide, Hawthorn, and GWS: 1% chance of playing Finals
Essendon: extreme longshots to play Finals
North Melbourne and West Coast: very likely to fight for the Spoon
(For details about the methodologies I’ve used, see this earlier blog).
LADDER FINISHES
The ladder projections using the Standard methodology (aka “cold” sims) appear on the left, and those using the Heretical methodology (aka “hot” sims) appear on the right.
Looking first just at the Standard Methodology, we see that the range of Expected Wins now runs from 3.7 to 15.7, which has shrunk a little in size from last week’s 4.0 to 16.6. We also see that 11 teams are still expected to finish with a win percentage above 50%.
The biggest decline in Expected Win tally came for Melbourne (-0.9), while the biggest increase came for Sydney(+1).
In terms of Top 8 chances, there were only two double-digit changes in estimate, including Sydney (+17% points), and Western Bulldogs (-19%).
Comparing the results for the Standard and Heretical Methodologies we find:
A much larger range of Expected Wins from the Heretical approach (2.4 to 16.1 wins)
A similar ordering of the teams in terms of Expected Wins with only Sydney and St Kilda, and Collingwood and Gold Coast, switched
Broadly similar estimates for the changes in teams’ Finals chances
TEAM AND POSITION CONCENTRATION
The HHI figures for the most recent simulation replicates appear below, with those from the Standard methodology on the top, and those from the Heretical methodology on the bottom. (For information about the HHI, also see that previous blog linked to earlier).
STANDARD METHODOLOGY
heretical methodology
Here we again find that the two methodologies assess most teams similarly in terms of the number of ladder positions they are effectively competing for.
Both methods suggest that teams are, on average, effectively competing for about 7.5 different ladder positions, and both have most teams competing for between 6 and 11 or 12 positions, the exceptions being Melbourne, Essendon, North Melbourne, and West Coast.
standard methodology
heretical methodology
They also have the average ladder position with effectively 7.5 teams likely to fill it, and with most ladder positions effectively expecting anywhere between 5 and 11 teams to be competing for them. The exceptions amongst the ladder positions are 16th through 18th. There is now considerably more uncertainty about 1st than there was a couple of weeks ago before Melbourne lost two in a row.
It is also, as usual, the mid-table positions that are associated with most uncertainty.
WINS AND LADDER POSITION
Here’s an updated view of the distribution of team wins and final ladder position, based on the Standard Methodology
If we, again, sum across all the teams, we can see how many wins are most likely for each ladder position, as shown in the chart below.
It’s now the case that 13 wins (44% of replicates) is slightly more likely than 12 wins (43% of replicates) to be associated with the team that finishes 8th. For the team finishing 4th, 14 wins (48% of replicates) remains slightly more likely than 15 wins (39% of replicates).
This, of course, varies by team, and in the chart below we look at how likely it is that a given team plays Finals if it records a particular number of wins, and how likely that outcome is. In the first chart we use the results from the Standard Methodology, and in the second chart from the Heretical Methodology.

We see that teams are less than 10% chances of playing Finals under either methodology with only 11 wins, and 20 to 45% chances of playing Finals with exactly 12 wins under the Standard Methodology, and 10 to 35% chances of playing Finals with exactly 12 wins under the Heretical Methodology, which tends to allocate more wins to teams that finish higher on the ladder. With 13 wins, an average team is an 80-95% chance of playing Finals under the Standard Methodology, and a 65-90% chance under the Heretical Methodology.
Repeating the analysis for finishing in the Top 4.
Here we find, again, somewhat different estimates depending on the methodology we choose. Under the Standard Methodology, 13 wins is associated with about 0 to 4% chances of a Top 4 finish, 14 wins with 20 to 55% chances, and 15 wins with 80-95% chances.
Under the Heretical Methodology, as noted above, more wins are associated with higher-finishing teams, and the equivalent percentage ranges are 0 to 2% for 13 wins, 5 to 25% for 14 wins, and 45 to 90% for 15 wins.
LIKELY IMPORTANCE OF PERCENTAGE
Next, we’ll use the Standard simulations to again investigate the estimated likelihood that any given pair of ladder positions be determined after Round 23 based on percentage.
The simulations are now suggesting there is a slightly less than an even-money chance that 8th and 9th on the final home and away ladder will be separated only on the basis of percentage, and a little less than a 1-in-5 chance that 8th and 10th will also only be separated on that basis.
There remains about an even-money chance that 4th and 5th will be decided on percentages, however, and now about a 3-in-10 chance that this will be how the Minor Premiership is decided.
IMPACT OF NEXT 5 GAMES ON TEAMS’ FINALS CHANCES
Finally, we’ll again investigate, this time using both the Standard (top chart) and the Heretical )bottom chart) methodology simulations, what each team’s estimated chances of playing Finals will be in five games’ time, depending on how many of those five games that team has won.
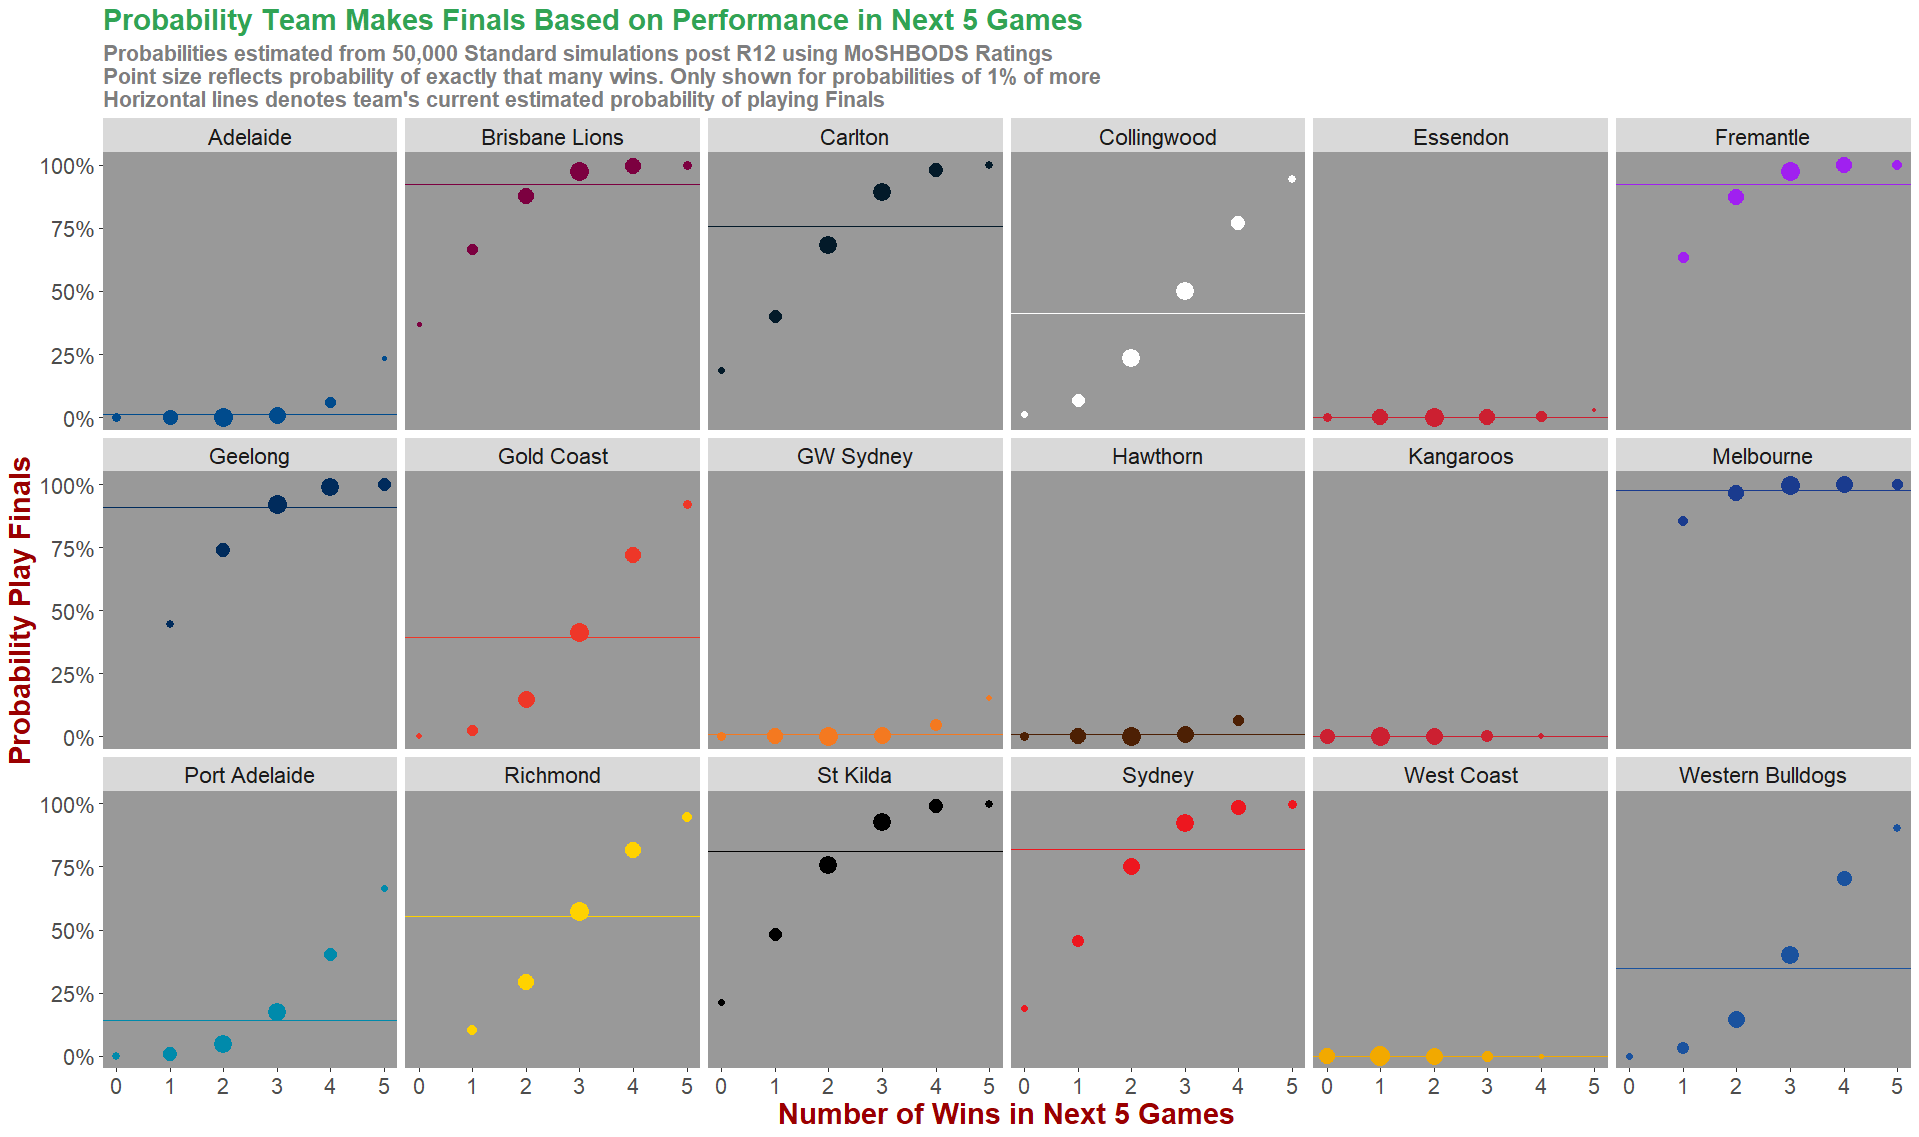
We see that most teams’ chances of playing Finals still increase only if they win at least 3 of their next 5 games, the exceptions being Adelaide, Essendon, GWS, Hawthorn, North Melbourne, and West Coast whose chances would only remain roughly the same with 3 wins.
