AFLW Round 10 Results - Regression Squared
/WoSHBODS tipped just 6 winners this week, and recorded a Margin MAE of 29.6 points per game and a Totals MAE of 20 points per game. That took it to a season long 73% accuracy, 18.5 Margin MAE, and 18.9 Totals MAE.
We can, as usual, review WoSHBODS’ Accuracy and MAE by subdividing games based on the final margin, which we do in the table at right.
It shows that WoSHBODS is now 55 from 63 in games that have been won by 2 goals or more, but also that its MAE is only 13 points per game across all the games won by under 3 goals.
In games won by less than 2 goals, WoSHBODS is only 11 from 28 in terms of accuracy.
We can also look at how WoSHBODS has performed on a team-by-team basis, firstly in terms of MAE, which we do in the table at left.
It shows that the final margins in games involving Hawthorn, Fremantle, or North Melbourne have been very well forecast - generally within about 14 points of the actual margin - while those in games involving Brisbane, West Coast, or Collingwood have been less well forecast and in error by as much as 4 or more goals.
Overall, game margins have been forecast with an MAE of 18.5 points per team per game.
We can also review how well WoSHBODS has estimated the victory probabilities of each team by looking at the log probability score recorded in those games in which they were involved, which we do in the table at right.
It reveals that WoSHBODS has done well at estimating win probabilities for games involving North Melbourne, Western Bulldogs, Melbourne, Geelong or GWS, and less well at games involving Brisbane, Collingwood, St Kilda, or Essendon. For those four teams, LPSs have actually been negative.
Overall, however, a positive LPS has been recorded for 14 of the 18 teams.
WAGERING
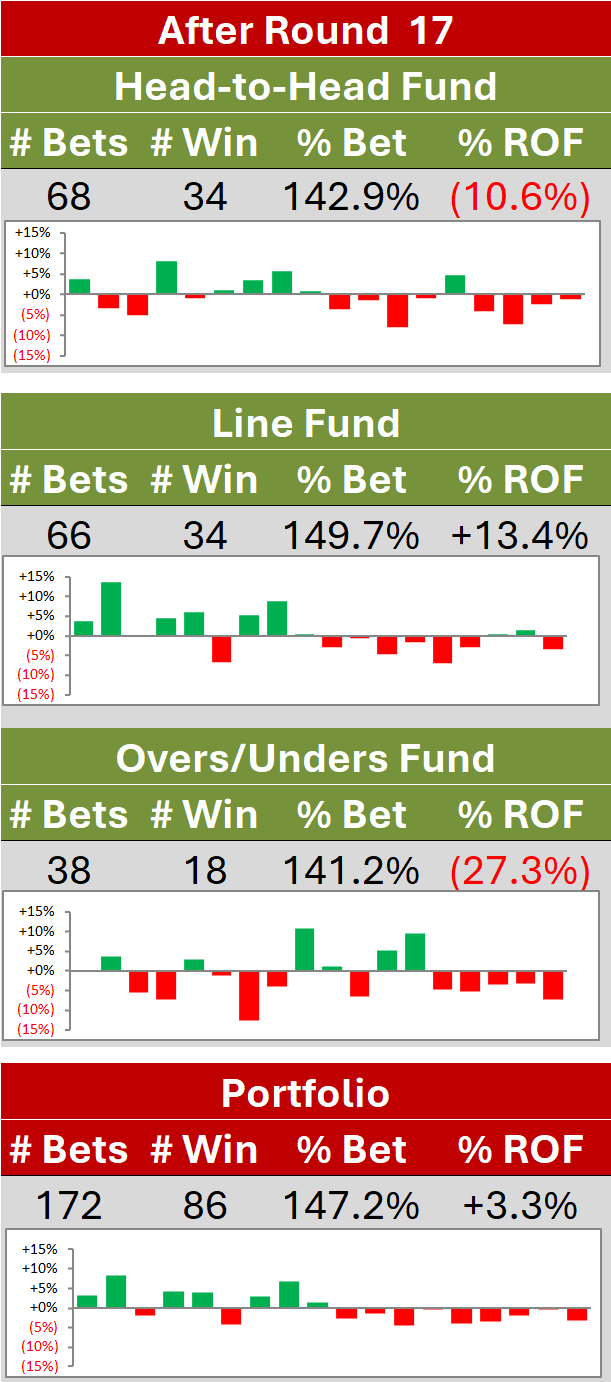
On wagering, Investors recorded their largest single-round loss this week, with both the Head-to-Head and Line Funds in red ink, and the Unders/Overs Fund recording only a small profit.
The Combined Portfolio finished down by 2.7c on the round, leaving the Combined Portfolio up by 14.6c on the season, that from a +16% ROI on a 0.92 turn.
Overs/Unders betting aside, which accounts for only 5% of the Combined Portfolio, we can review the wagering performance of the two main Funds by making separate calculations for home versus away status, and favouritism versus underdog status, which we do in the table at right.
Line betting on away teams remains attractively lucrative, as does head-to-head betting on anything but away team favourites.
TEAM DASHBOARD
In the latest Ranking on Dashboard Metrics chart, the metric rankings currently most highly correlated with the competition ladder rankings are:
MoS Win Production Function: +0.97
Points Conceded: +0.94
Scoring Shots Conceded: +0.92
% of Quarters Won: +0.91
Goals Conceded: +0.91
Own Points Scored: +0.88
Own Goals Scored: +0.88
Q4 Performances: +0.86
Own Scoring Shots: +0.85
Q2 Performances: +0.71
The metric least correlated is:
Opponent Scoring Shot Conversion: +0.43
A couple of the obvious things to point out here are:
Collingwood finishing 1st on Q1s, 2nd on Q3s, but 15th on Q2s and 18th on Q4s
Gold Coast finishing 15th, 11th, and 10th on Q1s, Q2s, and Q3s, and 12th on Percent of Quarters won and 11th on Scoring Shots
Lastly, below is the full and final extended version of the Team Dashboard.
It shows, among other things, that Adelaide lost only eight quarters all home-and-away season, and that GWS won only eight, and West Coast only nine. It also shows that Melbourne generated over 10 more scoring shots than their opponents across entire games, including 6 more of them per game in Q4s. They finish with a 796 percentage in that quarter.
Geelong finished scoring 33% of their points in Q1s, and conceding only 8%. Collingwood conceded 43% of their points in Q4s, Carlton 34%, and Geelong and GWS 32%. Melbourne conceded 37% of their points in Q3s but only 9% in Q4s. Collingwood also only scored 8% of their points in Q4s.
Hawthorn failed to win a Q1, and Adelaide didn’t lose a Q3 (but drew one, where their percentage is 483). Melbourne never lost a Q4.
Geelong finished with a Q1 percentage of 588, and North Melbourne a Q4 percentage of 241 and a Q1 percentage of 266.
GWS ended with a Q4 percentage of 29 and a Q3 percentage of 97., while Collingwood finished with a Q1 percentage of 253, and a Q4 percentage of just 16.