2023 - Round 11 : Action
/
There are a large number of mismatches this week, if ladder position is anything to go by. We have:
Only one game where the teams are separated by just one ladder position
Five games where they’re separated by between six and nine spots
Two games where they’re separated by exactly 11 spots
One game where they’re separated by exactly 16 spots
On average, the opposing teams are separated by a whopping 8.3 ladder spots this week, and the correlation between expected bookmaker margin and ladder position difference is +0.88.
That average bookmaker expected margin is, unsurprisingly, 23.6 points per game, which is up by over 8 points on the Round 10 average, and roughyl equal to the all-time average for Round 11s. It drives the all-Season average up to 17.6 points per game.
To the tips …
TIPS AND PREDICTIONS
This week’s underdog support comes from Home Sweet Home in 5 games, the RSMP twins, the MoS twins and ENS_Linear in the Blues v Swans game (where there are equal favourites, so Bookie Knows Best is given the Consult The Ladder tip), and MoSHBODS_Marg in the Tigers v Power game.
Amongst the Margin Predictors we’ve double-digit forecast ranges in four games, including a huge 29 points in the West Coast v Essendon game, 18 points in the Geelong v GWS and the Collingwoood v North Melbourne games, and 12 points in the Sydney v Carlton game.
MoSHBODS_Marg has Extreme Predictor status in five games, and MoSSBODS_Marg in four games.
Amongst the Head-to-Head Probability Predictors there are only two games with double-digit percentage point ranges: Sydney v Carlton (14% points) and West Coast v Essendon (14% points).
MoSHBODS_Prob and MoSSBODS_Prob have the most extreme probability estimates in five games this week, and Bookie_RE in four.
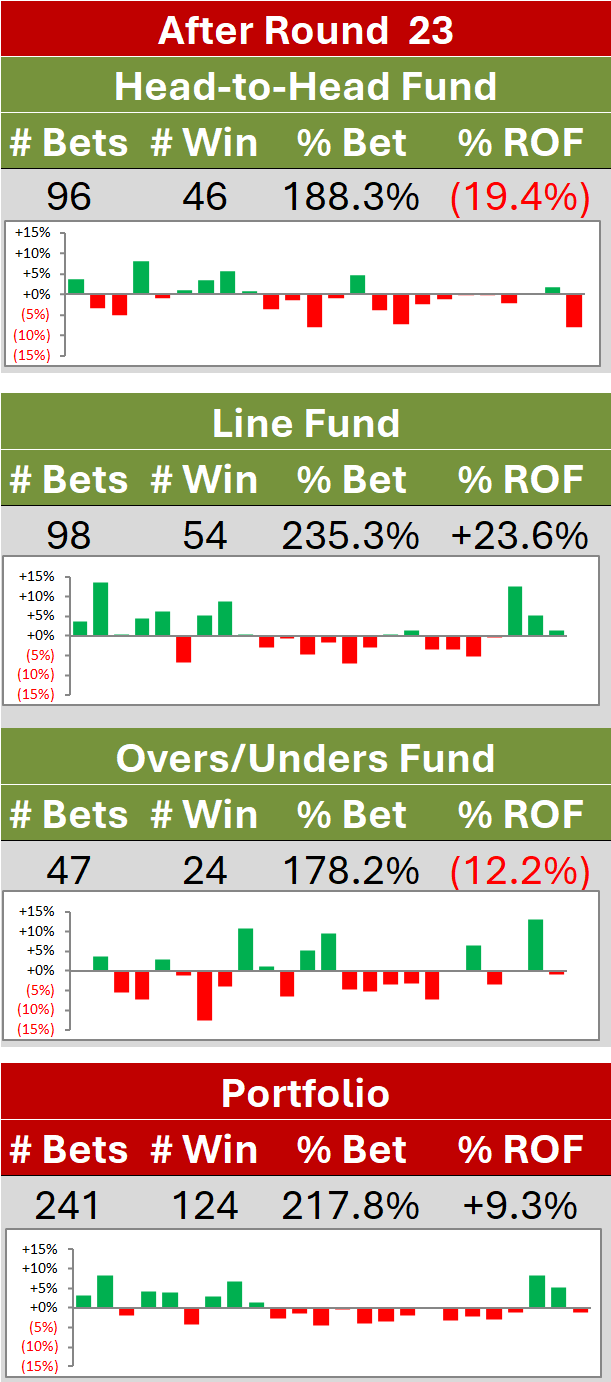
WAGERS
This week, there are four head-to-head and three line wagers. The four head-to-head wagers represent just under 6% of the original Head-to-Head Fund, and the three line wagers represent just over 7% of the original Line Fund. All seven wagers, all but one of which are on underdogs, represent 6.5% of the original Combined Portfolio, which is the second-highest total for a single round this season.
(Please click on the image below to access a larger version.)
This week, a real Ready Reckoner.
(NB an earlier version of this had erroneous wagers on Richmond in the Melbourne v Fremantle game [sic])
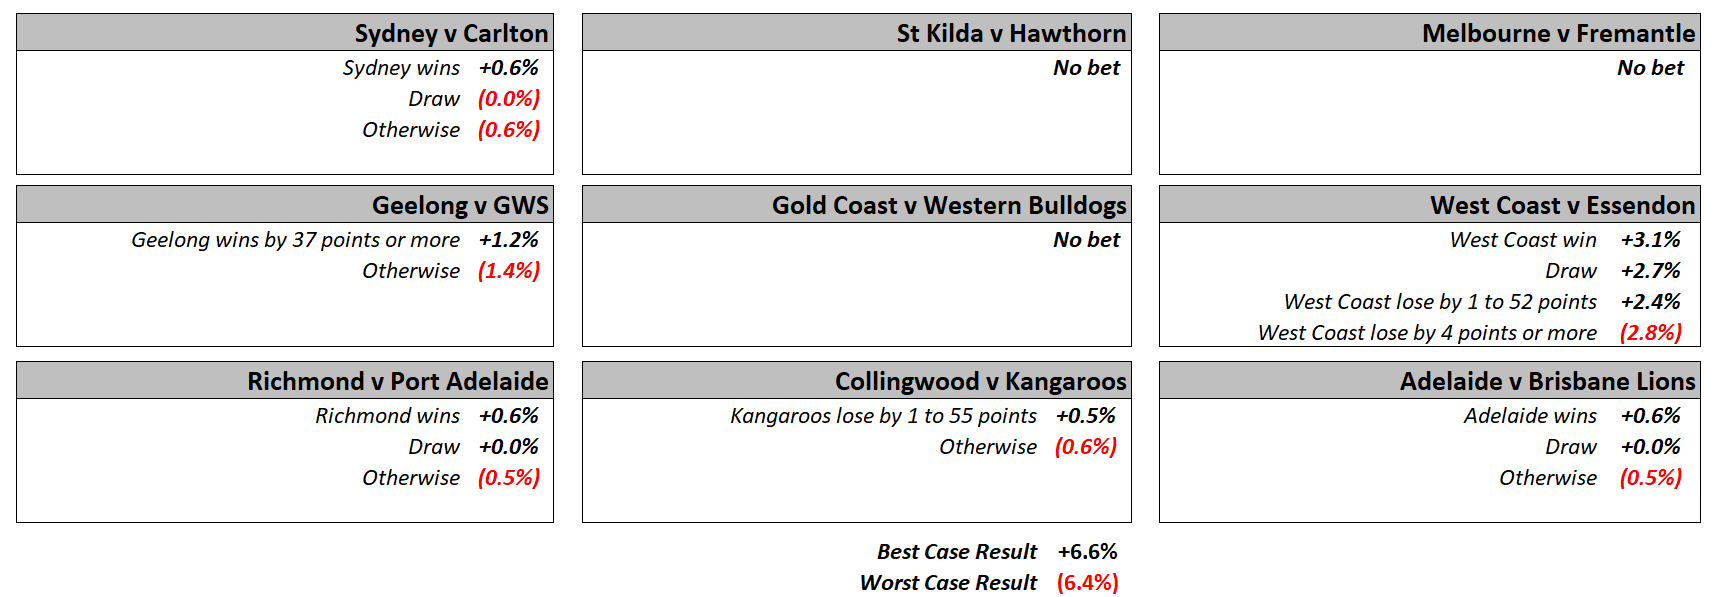
West Coast clearly carries the most risk for Investors this weekend, with the difference between best and worst results for them equalling almost 6% of the original Combined Portfolio. (And If that sentence doesn’t make you question the wisdom of blindly follow the models’ recommendations, I don’t know what will.) The next-most risk is carried by Geelong (2.6%), with Sydney, Richmond, North Melbourne, and Adelaide each carrying an additional 1.0% to 1.2%.
A best-case set of results will see the Combined Portfolio increase by just over 7c, and a worst-case set will see it fall by just under 7c.
To finish, here are MoSSBODS’ and MoSHBODS’ opinions about likely team scoring.
Commentary about these forecasts will come in the week's Overs/Unders blog and MoSHPlay’s various forecasts will be posted after the relevant team line-ups are made public.