2012 Round 6 Results : Predictable but Not Profitable
/A few of the favourites were extended this weekend but only one of them, Sydney, was toppled. Adding this week's 8 from 9 performance to the season's earlier results means that favourites have now won 44 of the 54 contests decided. Right now, the AFL can't buy a surprisal.
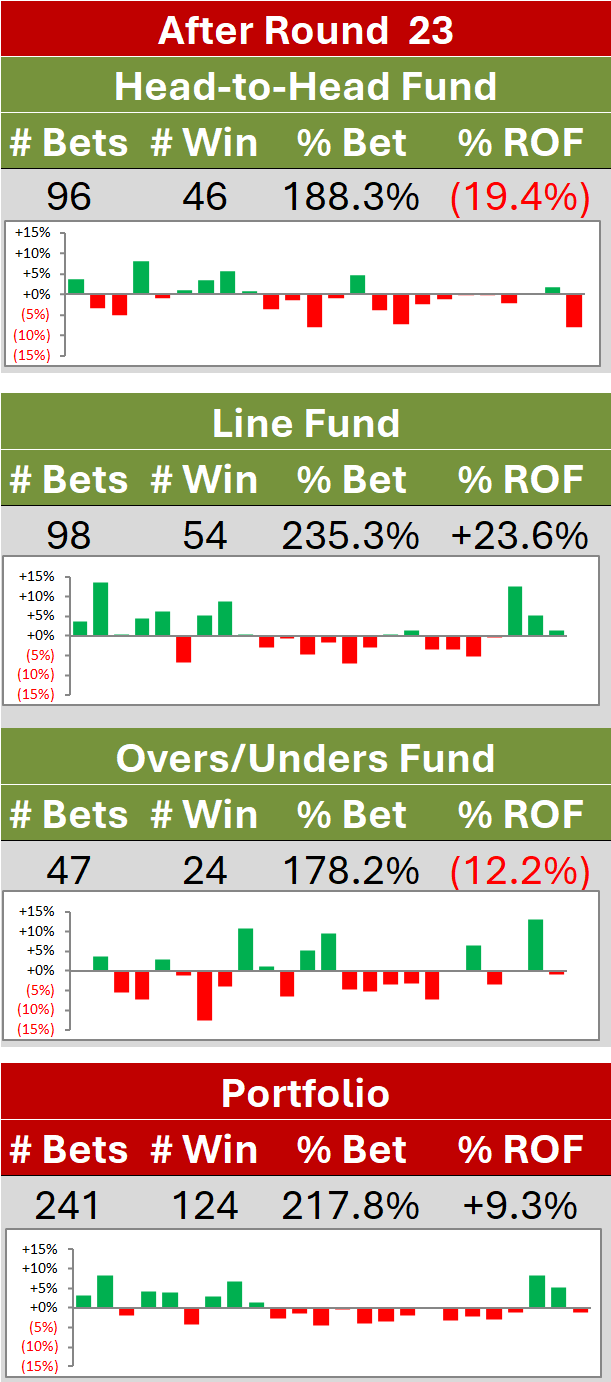
Investors weren't short of a surprisal or two though this round, many of them unpleasant. It all started well, with profit recorded in three of the first four games, but these early gains, and more, were lost by round's end. In total, the Line Fund went 3 and 3 to shed 1.5c, the Head-to-Head Fund went 0 and 1 to drop about 4.5c, and the Margin Fund went 0 and 5 to surrender another 12.5c. The net loss for the round then was about 4.6c - in truth not a bad outcome from a 3 and 9 weekend - leaving Overall Portfolios down 1.8c on the season.
Most Head-to-Head Tipsters revelled in the predictability of the results, a slew of them bagging 8 from 9 including BKB, and the entirety of them averaging 7.1 for the round. Thirteen tipsters remain atop the Leaderboard, all on 45 from 54 (83%).
This week I've changed the MAFL Tipster Dashboard a little. Most of the changes should be self-explanatory, except perhaps the new MAPE by Round section which shows each Margin Predictor's MAPE performance for each round so far this season in the form of a stacked bar chart. Smaller blocks signify smaller MAPEs - that is, better perfomance.

From the Dashboard you can see that Bookie_9 continues to lead all-comers, now with an MAPE of 25.13 points per game, ahead of Combo_7 on 25.68 and Win_7 on 26.07. Win_7 recorded the round's best MAPE, an amazing 15.33 points per game.
Scanning the blocks labelled R6 in the MAPE by Round section it's apparent that this was another round marked by extraordinarily low MAPEs generally. The all-Predictor average was, in fact, just 18.23 points per game,the second-lowest for the season, behind only last week's 16.44 points per game.
A review of the top half of the Margin Prediction section reveals a remarkable feature of Bookie_9's performance to date: its margin predictions have been within 12 points of the actual margin in almost 4 games in 10. As well, the two H2H Unadjusted Predictors have been with 6 points in almost 1 game in 4.
Once again this margin prediction accuracy translated into line betting prediction success. The all-Predictor average this week was 6.7 from 9, leaving CN2 as still the only Predictor with a below-chance season long line betting performance, and five Predictors with a 65% record. If only we'd known 6 weeks ago ...
Seven of these Margin Predictors would now also have produced a profit had their predictions been the basis of SuperMargin wagers simply by choosing the bucket into which their margin prediction fell, as you can see from the following table.
(BA, which stands you might recall for "Bookie Actual" and whose wagers are based on the line market points start, is not a Margin Predictor, though wagering on its predictions in the SuperMargin market would also have been profitable.)

This table has also been revamped and simplified for this week.
The left-hand third records the Margin Predictors' SuperMargin performance for all games. The stacked barchart shows the number of times the Margin Predictor has selected the correct bucket (in dark green), the number of times it's been off by one bucket (lime green), and so on for other sized errors. Under the column headed Preferred Only I've recorded the ROI that would have been achieved by following that Predictor's predictions by wagering only on the SuperMargin bucket into which its prediction fell. Then, under Preferred + Nearest I've recorded the ROI from wagering on the Preferred bucket as well as the bucket nearest the Predictor's prediction, while under Preferred + Neighbours I've recorded the ROI from wagering on the Preferred Bucket as well as the buckets on either side of the Preferred bucket.
In the middle third are the results for wagering only when the relevant Predictor tips a Home team win or draw and, in the rightmost third are the results for wagering only on Away team predictions. The columns headed % Predicted record the proportion of games in which the Predictor has made a prediction of the appropriate type. So, for example, BA has predicted a Home team win or draw in about 56% of contests so far this season.
One thing that this chart makes me thankful for is that I didn't choose Win_3 or Win_7 as the basis for the Margin Fund. These Predictors have selected the correct bucket in only 4 games all season but have been within one bucket in 20 games more. Only had we followed the Preferred + Neighbours strategy - and I doubt I'd have favoured this result - could we have turned this performance into a positive ROI.
Head-to-Head probability scores also remain at historically freakish levels, boosted by yet another week of positive scores for all Predictors, best amongst them WinPred with 0.67 Pieces per game. It remains in fourth overall, behind the two Head-to-Head algorithms and ProPred, though still ahead of the TAB Bookmaker. (To be fair I should note that I might have shaved a few Pieces from the TAB Bookmaker's performance this year by deeming him to price the markets he refuses to price at $1.01/$21. Serves him right for being unwilling to commit.)
The Line Fund algorithm recorded another negative week on probability scoring, a performance that was, regrettably, also reflected in the Line Fund's wagering outcomes.