The 2013 Draw : Winners and Losers
/With the first game of the pre-season now less than 7 weeks away, it's time to review the home-and-away draw for season 2013. The League introduced the freshly prepared menu to diners back in November with claims that it's fairer than last year's on the basis that it ensures:
- the teams from the top 4 meet the teams from the bottom 4 only once (with the exception of the twice-scheduled Sydney v GWS derby)
- the 10 non-finalists meet no more than two of last year's finalists twice
- the 8 finalists meet no more than two of last year's non-finalists twice

The table at right illustrates these deliberate biases in the draw, which are designed to ensure a relative preponderance of games pitting teams of similar strength against one another rather than teams of differing strength. By aggregating the data in the top left quadrant of the table we can calculate that the draw includes 41 of 56 (73%) possible matchups between last year's finalists, and by aggregating the data in the lower right quadrant we can similarly calculate that the draw incorporates 63 of 90 (70%) possible matchups between non-finalists.
In comparison, aggregating data from the remaining two quadrants reveals that only 47 of 80 (59%) possible matchups between finalists and non-finalists have been included in the season's 198 games.
Put another way, 104 games in the 2013 season will pit teams from the same "half" of the ladder against one another, while 94 games will involve teams from opposite halves. Note though that the bottom "half" is larger than the top "half", we makes this discrepancy of 10 games even larger in proportionate terms.
One other interesting bias that this table reveals is that of the 56 games pairing a team that finished between 13th and 18th last season with a team that finished in the top 4 spots, 31 of them (55%) take place as a home game for the weaker team.
All of the home-and-away action is once again spread out over a 23 round season, commencing with an Adelaide v Essendon clash on March 22 at Football Park in a 1st round that finishes 9 days later on April 1 with a Hawks v Cats Grand Final rematch at the G. As was also the case last season, all 18 teams take part in 20 of the rounds while in the remaining three rounds - again the 11th, 12th and 13th - six teams have byes.
A number of teams have agreed to transfer home games to alternative venues this year, most notably the Saints, who'll meet the Swans in Wellington, NZ on ANZAC day in Round 5, and the Tigers, who'll meet the Gold Coast at Cazaly's Stadium in a Round 16 matchup on July 13. In total, seven different teams have transferred 13 Home matches, in many cases negating - or, in the Tigers' case, even reversing - the benefit conferred by making your opponent travel interstate while you get to sleep in your own bed.
Viewed from a home-and-away and an Interstate Status standpoint, this year's draw looks like this:
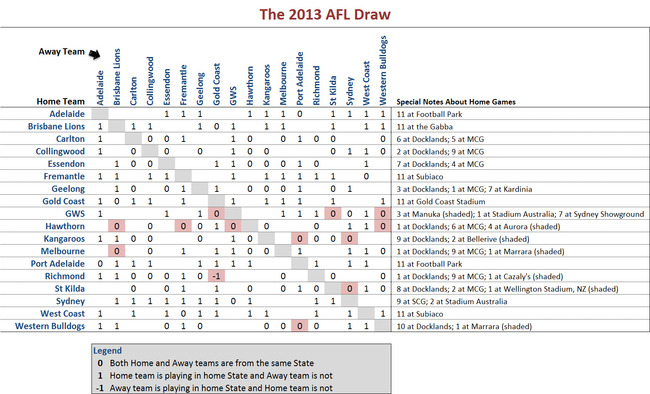
Partly as a result of moving home games to other venues, the Hawks, Roos and Tigers enjoy Interstate Status (ie have a 1 against a home game in the table above) in only 3 games this year, which stands in stark contrast to the 10 games in which each of the non-Victorian teams, GWS aside, enjoy such status. Other teams that have Interstate Status relatively rarely this season are the Saints, Carlton and Collingwood, who each have it only 4 times, and Essendon, Geelong and the Dogs, who each have it only 5 times.
(For a full copy of the 2013 draw head over to the AFL's own site.)
MEASURING THE EFFECTS OF IMBALANCES IN THE DRAW
Biases in the draw affect the prospects of individual teams differentially and can be quantified in a number of ways. This year, as last year, I'll assess team-by-team impacts in terms of changes in expected winning percentages and in terms of changes in the probabilities of making the top 8 and the top 4.
These changes will be measured by projecting the season on the basis of the actual draw, then projecting the results of the "missing" games and comparing each team's fate in the projected actual season with its fate in the full, extended season. To make these projections we need a statistical model, for which purpose I'll reuse (a slightly simplified version of) the model that I used last year which takes as inputs the relative strengths of each team and the Interstate Status of each contest.
Prob(Home Team Win) = 0.0391 + logistic(0.0344 x (Home Team MARS Rating - Away Team MARS Rating) + 0.3995 x Interstate Status)
(Last year I used the original form of this equation which required that I centre the Ratings of all Home and all Away teams in every game of the season by subtracting about 1,001.4 from the Rating of every Home team and by subtracting about 1,001.1 from the Rating of every Away team. The net effect was to reduce the difference between the Ratings of the Home and Away teams by 0.3 Rating Points. This year I've ignored this deduction; the effect, if any, is minor.)
This model requires MARS Ratings as inputs. Once more mirroring the approach used last year I've used two sets for today's blog:
- Set A - the MARS Ratings that we'll be using for Round 1 of this season, which are for each team 47% of their final season 2012 MARS Rating plus 530.
- Set B - the final season 2012 MARS Ratings.
We need also to make an assumption about the venues for all "missing" games. I've assumed they were played at the Home team's usual home ground.
I did consider including number of days rest in the model this year, but a recent analysis suggests that this is not warranted.
CHANGES IN EXPECTED WINNING PERCENTAGES
As a first measure of the effects of the imbalanced draw, consider each team's projected winning percentage in the actual and in the extended seasons.
(NB All results in this blog are based on 10,000 simulations of the season, which means that the worst-case 95% confidence intervals are about plus or minus 1%.)

Using the Set A Ratings - those we'll use for modelling purposes for Round 1 of the season - the differences in projected winning percentages span the range from +3.6% for Melbourne to -2.4% for Collingwood. In other words, on this measure Melbourne benefits most from the imbalance in the draw, and Collingwood benefits least. Using Set B Ratings instead, the differences range from +5.4% for Melbourne to -4.3% for the Roos. The wider range for Set B is a consequence of the generally larger Ratings differences between teams in Set B compared to those in Set A, coupled with the nature of the bias in the draw.
Logically, imbalancing the draw to reduce the number of likely mismatches should disproportionately disadvantage stronger teams because they are more likely to win the games they don't get to play, while the opposite should be true for weaker teams. This is, indeed, what we see in the table above.
If we rank all 18 teams in terms of the difference in their expected winning percentage based on the actual draw versus what we'd expect in an extended, all-play-all season using Set A Ratings (ie we consider the first column headed "Diff" in the table above), six of last year's finalists are amongst the seven most-disadvantaged teams. The odd team out in terms of being more disadvantaged than their ladder position might be said to warrant is the Tigers, who rank 5th in terms of disadvantage despite finishing 12th on the ladder.
Conversely, the Crows find themselves relatively less disadvantaged than their top 4 finish might suggest they deserve. They rank only 13th in terms of disadvantage.
The following chart provides the team-by-team impacts on winning percentage under both sets of Ratings.

This relatively crude measure of disadvantage - the difference in winning percentage that results from curtailing the draw - produces a very similar ranking of the teams to that which Rohan Connolly came up with using his more detailed methodology.
Winning more games, however, is a means to an end and not an end in itself. Frankly, knowing that the draw boosts the expected winning rate of GWS by almost 1% point doesn't count for much unless that gives them a significantly greater chance of making the Finals. Fairly obviously, by altering their expected winning percentage from about 19% to 20%, it doesn't: 5 wins isn't going to be the price for even the cheapest seats at the September ball.
CHANGES IN FINALS PROSPECTS
In this next table I've recorded the probabilities for each team finishing in the Top 8 or the Top 4 in the actual season versus the all-play-all, extended season, again using the two sets of team Ratings.

First let's consider the leftmost column headed "Diff". This records the difference is the likelihood of a team finishing in the top 8 when comparing the results for the 10,000 simulations of the all-play-all season with the actual 2013 draw.
The Lions, the Dons, Melbourne and Port Adelaide are the big winners in terms of percentage point increases with each enjoying at least a 5% point increase in their chances as a result of the truncated draw. In Melbourne's and in Port Adelaide's cases this serves only to transform them from very unlikely finalists into outside chances at best, but these additional tickets in the lottery come as a gift from the League so they might as well scratch them.
Collingwood, especially, and Geelong stand out as the teams most disadvantaged by the draw in terms of their respective chances of playing in the Finals. In an all-play-all season, the Pies would be almost 3/1 on chances to make the 8 but with the draw as it is they're only about 8/5 on prospects - still more likely than not to be playing in September, but by no means as assured.
The results for Richmond provide an interesting example of why it's important to consider more than just winning percentage when assessing the impacts of the Draw. Under the Set A Ratings, the Tigers are the 5th most disadvantaged team in terms of absolute percentage point reduction in winning percentage, but they enjoy an increased likelihood of making the final 8 under the truncated draw. This is because the teams with which they are projected to be most likely to be vying for a spot in the bottom end of the 8 - the Roos and, to a lesser extent, the Blues - suffer about the same or even greater disadvantage in the curtailed season. So much so in fact that, in an all-play-all season the Roos move from having an inferior expected winning percentage to the Tigers (50.1% vs 51.4%) to having a slightly superior expected winning percentage (52.5% vs 52.2%).
The general lesson here is that what matters most for the prospects of a team on the fringe of the 8 is what the Draw does to the prospects of other teams near the fringe too, not what it does to the giants and the minnows.
If we use Set B Ratings instead the picture is a little different, especially for Richmond, though the sign on the impacts for all teams except Carlton are the same as they are when Set A Ratings are used. (Forced to choose, I'd prefer Set A Ratings over Set B Ratings, partly because of their more conservative nature.)

The table above also provides data about the impact of the imbalanced Draw on the chances of each team finishing in the Top 4. These numbers are shown in the righthand columns of that table, the two "Diff" columns from which are charted below.
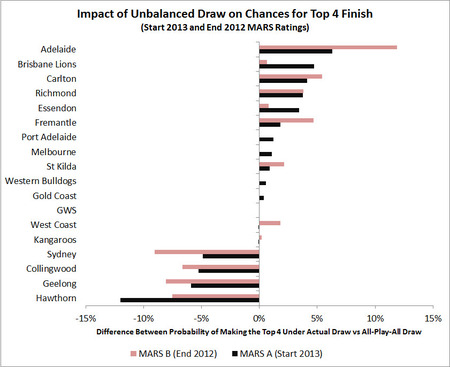
What this chart depicts so starkly once again this year is how the imbalance in the draw transfers opportunity from strong teams to weaker ones - not so much to the weakest teams of all, but instead to those teams likely to be on the fringes of the Finals. Five of the seven most-advantaged teams in the chart at left (using Set A Ratings) are the teams ranked between 8th and 14th on MARS Ratings at the end of season 2012; the six most-disadvantaged teams in the chart include the five highest MARS Rated teams.
In all of the tables so far there have been columns labelled "Actual - True Home", which record the estimated change in each team's performance if, instead of extending the season by notionally playing the "missing" games, we moved all home games in the actual draw to each teams' usual home ground, rather than playing some of them at other venues.
For Hawthorn, for example, that would mean shifting the four games it's scheduled to play at Aurora Stadium this year back to the MCG. Since, again this year, three of these games pit the Hawks against a non-Victorian team, such a shift would materially alter the Hawks' estimated victory probabilities in those games.

The chart at left shows the impact on all teams of playing games such as these at venues other than teams' normal home grounds. Negative values imply that the team has been relatively disadvantaged by this practice and positive values imply the opposite. All the projections here use Set A Ratings and what's charted are the impacts on the teams' chances of making the top 8 and the top 4.
In terms of impacts on Top 8 finishes, Richmond, the Roos, the Pies, the Hawks and the Dees fare worst, while six interstate teams in Sydney, the Lions, West Coast, Fremantle, Port Adelaide and Adelaide, none of which have transferred a single home game, fare best.
It's relatively easy to imagine how Richmond, the Roos, the Dees and the Hawks are negatively impacted by the switching of home games as they each have at least one home game of their own that's been switched. The impact on the Pies, however, is more subtle and indirect and is a consequence of how the changes in venues, relatively speaking, enhance the opportunities for other teams vying with the Pies for a spot in the Top 8.
Venue-switching reduces the Top 4 chances most of all for the Tigers, Roos, Pies and Hawks, and increases the Top 4 chances most of all for Sydney, the Blues and Fremantle. Sydney and Fremantle are both direct beneficiaries of the switching of home games, with Sydney facing the Roos at Bellerive and the Saints in NZ rather than at Docklands, and Fremantle playng the Hawks at Aurora Stadium rather than at the G.
SOME FINAL THOUGHTS
Again this year I find myself wondering how explicitly the respective Boards of the teams who've agreed to play home games away from home have weighed the benefits - financial and otherwise - against the costs in terms of reduced likelihood of playing in the Finals.
For the Hawks the costs are probably small. They're very likely to make the 8 and would probably finish with the same number of wins regardless of where their switched games were played. Still, in probabilistic terms, they are paying a price.
The costs are probably also small for the Giants, the Dees and the Dogs but for slightly different reasons. They're relatively unlikely to make the Finals, and will probably miss by more than a game or two, so tweaking the odds on a handful of games probably matters little.
But, for the Tigers, the Saints and the Roos, the costs could be far higher, even though they're only switching a game or two. How do you put a price on a 3 to 4 percentage point reduction in a team's chances of making the Finals?
