MAFL 2013 : Team Dashboard for Round 17
/This week I thought I'd look again at the rank correlations between teams' competition ladder positions and their ranking on some of the metrics from the Team Dashboard.
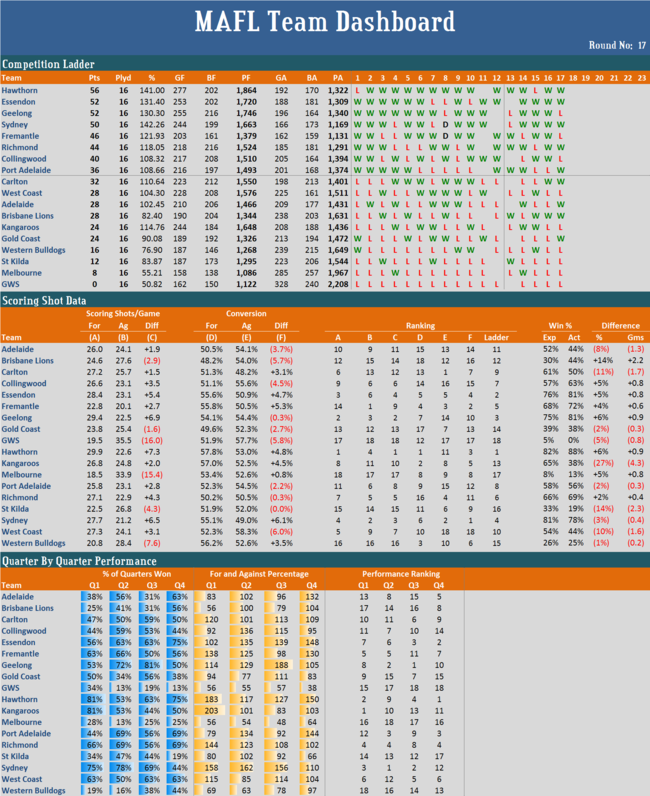
Currently, the metric most highly correlated with ladder position is the number of Scoring Shots conceded per game for which the rank correlation is +0.90. The next most highly correlated metrics are Scoring Shots created (+0.83) and the teams' performances in 2nd Quarters (also +0.83).
Thereafter come teams' performances in 3rd Quarters (+0.79), teams' performances in 4th Quarters (+0.72), and then teams' performances in 1st Quarters (+0.66). Teams that have led at the first change this season have won only about two-thirds of the time. That's similar to the rate achieved in 2011 but significantly lower than the rate of about 75% that we witnessed in 2012.
The only metrics less correlated with teams' ladder positions are the teams' scoring shot conversion metrics. Teams' own scoring shot conversion rate correlates at only +0.32 with their ladder positions, while the average conversion rate of their opponents correlates at only +0.21. As I think I've noted before, this season has been about the volume of scoring shots created and conceded by teams, not about the rate at which those scoring shots have been converted.
(I'll just note in passing that the Roos, on the back of another loss with a score than would win most games (16.12), have now won almost 4.5 games fewer than their aggregate scoring shot performances for the season and MAFL's Win Production function suggest they should have.)