Is Favourite-Longshot Bias Evident in Bookmaker Data for the AFL?
/More than once here on the MoS website we’ve looked at the topic of favourite-longshot bias (FLB), which asserts that bookmakers apply a higher profit margin to the prices of underdogs than they do to favourites. In one MoS piece (15 years ago!) I had more of a cursory look and found some evidence for FLB using 2006 to 2008 data, and, in another piece, a few years later I had a more detailed look and found only weak to moderate evidence using opening TAB data from 2006 to 2010.
At this point I think it’s fair to say that the jury is still out on FLB’s existence, and waiting for more convincing evidence either way (and very unhappy at having been sequestered for 13 years in the meantime).
THE DATA
For this analysis we’ll be using data from the AusSportsBetting site, in particular the closing head-to-head prices for 2,375 AFL games from 2013 to 2024. Since we need implied probability data for the analysis, we’ll use the Basic method to infer this from the raw price data (which we found was a reasonable method to use in this earlier blog).
RETURN VERSUS RISK

If FLB exists then it must be the case that wagering on favourites will be more lucrative (or less loss-making) than wagering on underdogs, so we could chart, as they did in “Explaining the Favorite-Longshot Bias: Is it Risk-Love or Misperceptions?” - Erik Snowberg and Justin Wolfers, NBER Working Paper No. 15923, April 2010, JEL No. D03,D49,G13,G14,L83, return versus (log) odds.
Their chart, which is based on 5.6m horse race starts, shows clear evidence for a favourite-longshot bias, starting most notably at odds of about 20/1 and showing markedly unprofitable wagering, on average, for horses priced any longer than that.
Each cross on the chart summarises those 5.6m starts using percentiles, and so represents over 56,000 starts. We only have prices for just under 5,000 teams and plan to, initially, analyse home and away teams separately, and so divide the data into 25 groups, each representing 4% of the total, roughly 2% home and 2% away prices.
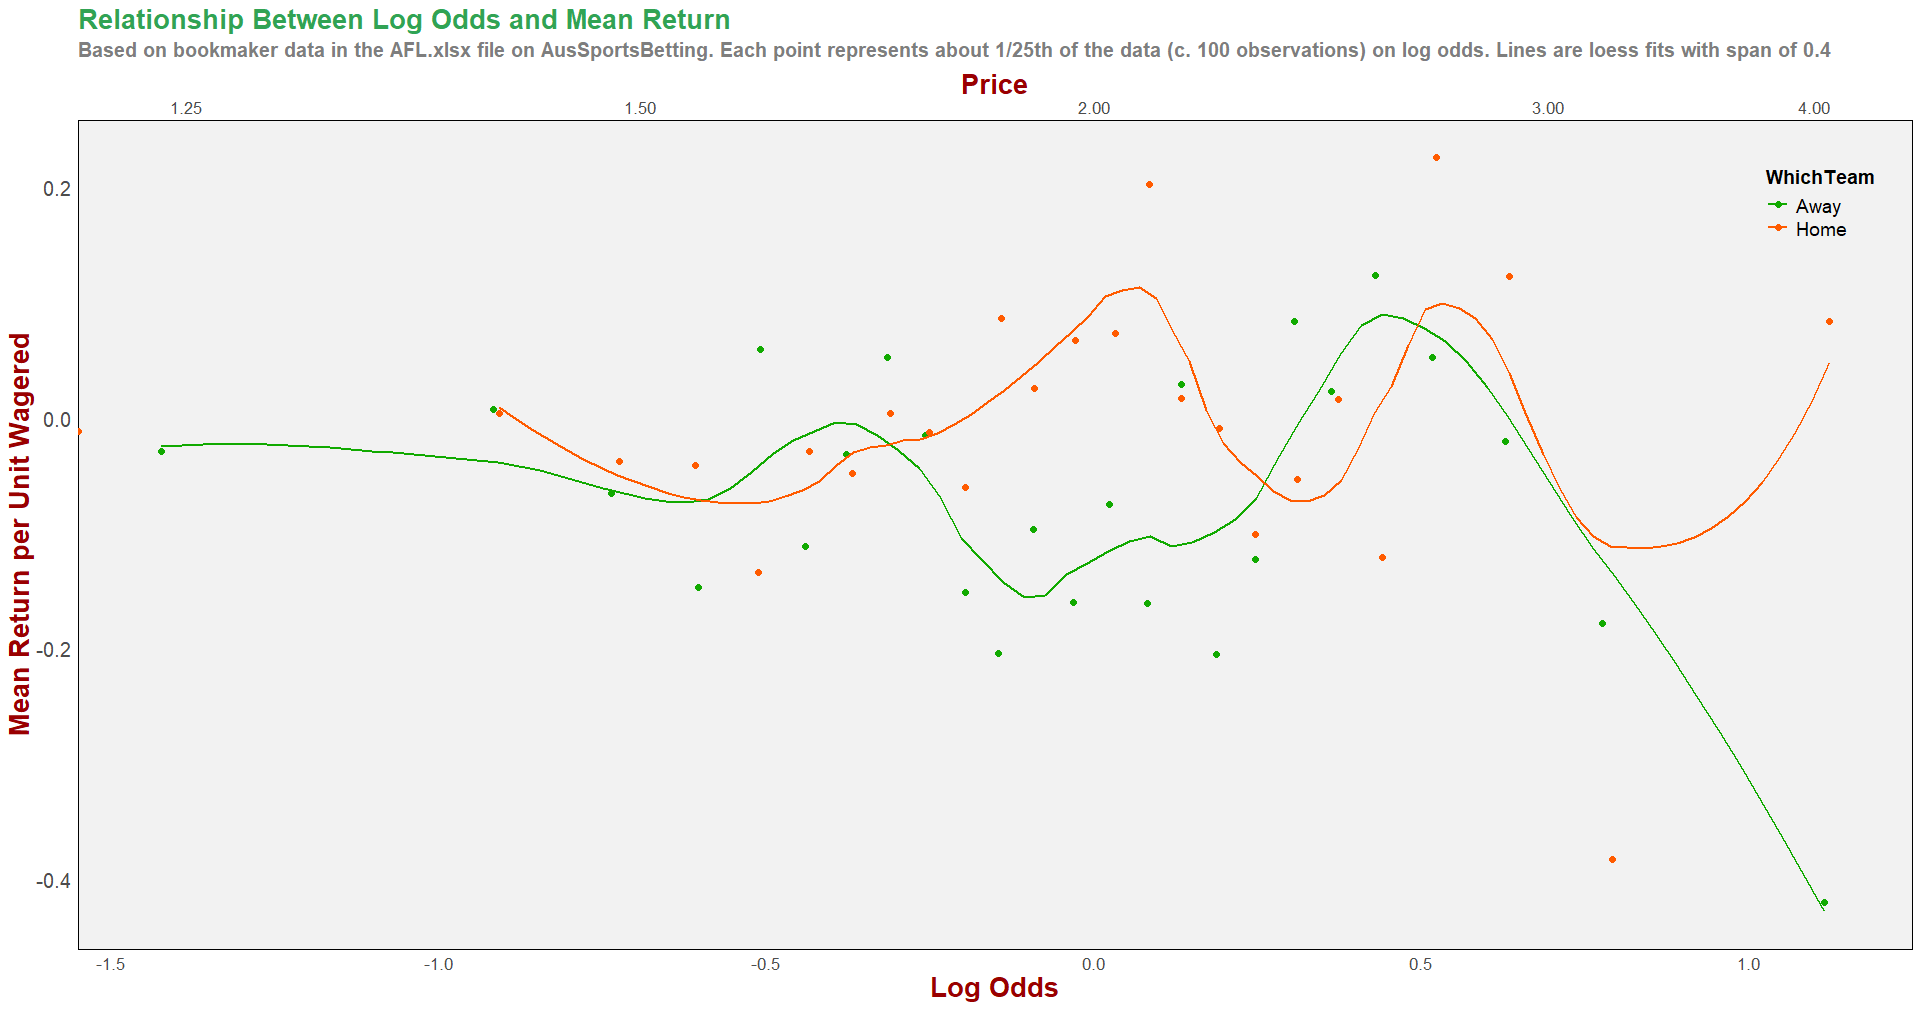
Our chart appears at left, and includes a loess fitted overlay that hints that there might be a favourite-longshot bias, but only for away teams and prices above about $2.50.
However, the only away team data point sitting well below all of the others and hinting strongly at a favourite-longshot bias is the last one, which pertains to prices of around $4.00 and above.
If you think about it for a moment, you’ll realise that this approach suffers from a major challenge: the variability of our return estimates increase with the odds.
Consider, for example, 50 wagers on 20/1 shots. If, in our sample, just two of those are collects, then our net return is 2 x $20 + 48 x (-$1), which is -$8, representing a return of -16%. Now imagine that, purely due to chance, the sample we’d acquired had just one additional collect. For our sample, the new net return is 3 x $20 + 47 x -($1) = +$13 or a +26% return. A single additional win has altered our rate of return by 42% points.
Next, consider 50 wagers on 1/1 shots. If, in our sample, just 24 of those are collects, then our net return is 24 x $1 + 26 x (-$1), which is -$2, representing a return of -4%. Now imagine that, again purely due to chance, the sample we’d acquired had just one additional collect. The net return then is 25 x $1 + 25 x -($1) = $0 or a 0% return. Here, the additional win has altered our rate of return by only 4%.
That difference in the sensitivity to sample variation makes it far more difficult to get precise estimates of the average return on longshots than to get equally precise estimates of the average return on favourites. That will be far less important when you have a sample size of 5m than when you have one of about 2,400, which is about 0.05% of the size.

Before we investigate a more straightforward metric for detecting FLB, let’s just do a couple more more things.
Firstly, if we were to proceed in the most simplistic manner and try a linear smooth on the data points, separately, for the home and away data, we’d end up with what we see in the chart at right, which suggests that the return on home team wagering barely changes as home team odds rise and that the return on away team wagering declines a little as away team odds rise. In other words, we might conclude that there is no evidence for FLB in home team prices, but some in away team prices. We are still, however, ignoring the differential variability of the points as we move from left to right.
Lastly, what if we want to attempt to fit the apparent bends in the data that we see with the loess smoothing. For that purpose I’m going to use Multivariate Adaptive Regression Splines (MARS) for the home and the away models.
MARS uses it own tests of significance in choosing how many, where and whether to allow “knots” or kinks in the fitted models, and both the home and the away MARS models wind up being nothing more than an intercept. This implies that the “best” models merely predict some fixed return across all prices (log odds). That fixed “prediction” is for a 0.4% loss on home team wagers, regardless of price, and a 7% loss on away team wagers, also regardless of price. So even the straight line we got using loess in the previous chart disappears entirely if we fit a flexible model to the entirety of the data.
That should make us a bit more suspicious about the existence of FLB in this data. A quick look at the risk-return data offers nothing encouraging.
It is interesting to note, however, how much more common it is for home teams to be strong favourites and away teams heavy underdogs. In the top category where prices are from $1.01 to $1.33, home teams predominate by over 2:1 while in the bottom category where prices are $3.50 and above, away teams predominate by over 2:1.
CALIBRATION
Setting aside return on wagering versus log odds as our litmus test then, we coud instead revert to a far simpler metric of actual win rate versus expected win rate (given head-to-head prices) approach. In other words we could ask, do teams with lower prices (ie favourites) win more often that their price would imply in terms of probability, and do teams with higher prices (ie underdogs) win less often that their price would imply in terms of probability?
In the article Journal of Behavioral Decision Making, J. Behav. Dec. Making, 22: 318–337 (2009), Published online 25 November 2008 in Wiley InterScience (www.interscience.wiley.com) DOI: 10.1002/bdm.629 they allude to the simple logit model ln(Win%/(1-Win%)) = k x ln(P/(1-P)), which we fit in R using
glm(Win ~ 0 + LnProbRatio, data = afld_all, family = "binomial")
The coefficient, k, on LnProbRatio informs us about the presence or absence of favourite-longshot bias. A value of k equal to 1 implies that the actual win rate is close to the win rate implied by the prices, while a value of k greater than 1 implies that the actual win rate rises with the implied win rate: a favourite-longshot bias.
On fitting the model to the home team data (using the Basic method to infer probabilities) we get a k value of 0.9795 with an SD of 0.04937, suggesting that the null hypothesis of no favourite-longshot bias cannot be rejected Pur coefficient is less than 1 standard deviation away from 1).
A quick technical side-note: it’s pointless fitting this model to the home and away data separately because we wind up with identical results. That’s because every win for the home team is a loss for the away team, and vice versa, and because the home team’s ln(Prob/(1-Prob)) is paired with with the away team’s ln((1-Prob)/Prob) in the same game, which is just -ln(Prob/(1-Prob)). Put another way, the existence of FLB in home closing prices implies the existence of FLB in away closing prices, so we need focus on only one of them.
This modelling, then, offers no support for the existence of any favourite-longshot bias either.
We can further investigate this visually by charting the actual vs expected win rate for games grouped into decile based on bookmaker home closing prices.
Any favourite-longshot bias would appear here as home teams with high estimated probabilities winning “too often” (ie the last few rightmost data points being well-above the diagonal) and teams with low estimated probabilities not winning “often enough” (ie the first few leftmost data points being well-below the diagonal).
There is clearly no evidence for a favourite-longshot bias here.
WELL MAYBE NOT EVERY YEAR …
Maybe FLB is a more ephemeral thing, or even a more recent thing. To investigate this we’ll finish the analysis by determining whether, notwithstanding the absence of strong evidence for a favourite-longshot bias when the home data is considered as a whole, such evidence might exist for just one or more of the 12 years for which we have data.
Bear in mind that any such evidence will, of neccesity, be based at most on a few hundred data points and so be subject to even higher levels of sampling variation.
The first pieces of evidence we’ll inspect are the coefficients that we get when we fit the earlier logit model to individual year’s home closing price data. These appear in the table at right and offer no strong evidence for FLB in any single year.
The 2020 season appears to be the best candidate for FLB with a co-efficient of 1.40, but that value is only about 1.5 standard deviations away from 1, and so offers weak evidence at best.
We should also note that there is equal or near-equal evidence for the existence of a bias towards underdogs in seasons 2017 (1 standard deviation below 1) and 2021 (1.6 standard deviations below 1).
All-in-all, at this point I think all you could say is that home (and, by implication, away) teams all seem to win about at a rate equal to what their closing prices would imply.
Or, in other words, that the bookmakers are well-calibrated.
Let’s just confirm that, too, on a year-by-year basis, again looking only at home team data for the reasons noted.
We can see from this chart why 2020 might have produced a coefficient above 1 given that the 4th data point (home team mild underdog) is well below the diagonal, and the 6th, 7th and 10th (home team mild to strong favourite) are above the diagonal.
The 2017 season is clearly influenced by the 2nd data point and the 2021 season by the 2nd, 3rd, nad 9th data points.
None of them show the pattern that would be most indicative of FLB: the 1st data point well below the diagonal and the 10th well above the diagonal (and possibly the 2nd also below and the 9th above).
There is then, scant evidence of FLB in any single year of the data.
SUMMARY AND CONCLUSION
We came into this blog looking for evidence of favourite-longshot bias in the bookmaker pricing data we have and, for the most part, found none.
Does that mean that there’s no favourite-longshot bias in AFL wagering markets? Probably, but with one caveat.
In the very first chart in this blog we noted the appearance of FLB, but also noted that it kicked in most obviously for odds of 20/1 or longer. Those sorts of odds are very rare in the head-to-head AFL market, indeed there are only 12 examples for home teams in the data, all 12 of which were lost by the home team, and 33 examples for away teams in the data, all 33 of which were lost by the away team.
So, it might be the case that FLB does exist for very extreme prices, but the rarity of them means we’d need a much larger data set to detect them. As so often is the case in data analytics, we really do need more data to be certain.
That said the practical implications of a phenomenon that applies to, maybe, 0.5% to 1.5% of cases must surely be minimal.
Let’s conclude then with:
“FLB probably doesn’t exist in AFL head-to-head closing prices and, if it does, likely applies only at extremely short and extremely long prices to an extent that renders it safely ignored about 99% of the time.”
