2014 Margin Predictor Team-by-Team Performance (R1 to R12) : Part II
/In the previous blog we looked in some detail at the performance of each of the MatterOfStats Margin Predictors in terms of how well they've done in predicting the final margins in games involving a particular team as the home or as the away team.
Today I want to provide, initially, a team-based summary of that same analysis.
Here firstly then is a table recording the best and median/average Predictor performance for every team when playing at home or playing away, using both mean absolute and median prediction error as the performance metric.
This table shows, for example, that the best Predictor of Western Bulldogs' results when they're playing at home has been Combo_NN_2 if we use the Mean Absolute Prediction Error (MAPE) metric, and ProPred_3 if we use the Median Prediction Error (Median PE) metric. Also, the all-Predictor MAPE for the Dogs is just 17.4 points per game and the all-Predictor Median Median PE (yes, that's right, the Median of the Median PEs) is 16.9 points.
Drawing on the results in this table, we can say that, regardless of whether we use the MAPE or Median PE metric, the final margin in games where:
- Carlton, Collingwood, Melbourne or the Western Bulldogs were at home have been relatively easy to predict.
- Essendon, Hawthorn, the Kangaroos or Sydney were at home have been more difficult to predict.
- Adelaide, Gold Coast, Port Adelaide, West Coast or the Western Bulldogs were playing away have been relatively easy to predict.
- Geelong, Melbourne, St Kilda or Sydney were playing away have been more difficult to predict.
Currently on MatterOfStats, the best Margin Predictor, Win_7, has a MAPE of 30.4 points per game. Combining the best Predictor results for each team produces a 27.3 MAPE if we use only the results for teams when playing at home, and a 27.0 MAPE if we use only the results for teams when playing away. Of course, that ensemble result presupposes we might somehow have known beforehand which Predictor would do best with each team, but it's an interesting way to quantify an absolute cap on margin prediction performance for the season to date nonetheless.
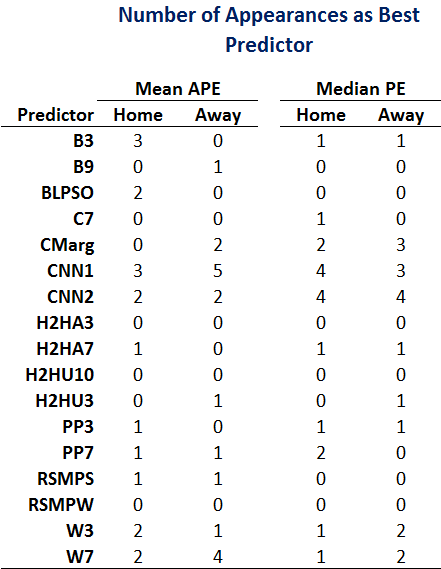
Speaking of analysing the Predictors that have performed best with each team, I'll finish today with a table recording the number of teams for which each Predictor is best on the four views we've been adopting in this blog.
One aspect of this table that I find interesting is how the performance of some Predictors alters when we switch from the MAPE to the Median PE metric. C_Marg and Combo_NN_2 benefit most from this change in metric, being best Predictor more often when we use Median PE rather than MAPE. The Predictors that suffer most are Win_7 and, to a lesser extent, Bookie_3 and Bookie_LPSO. All three of these Predictors currently sit in the Top 5 Predictors on the MatterOfStats Leaderboard, which is of course based on MAPE. C_Marg and Combo_NN_2 meantime, currently occupy the bottom two positions on that same list.
At some point I think it might be instructive to investigate whether MAPE or Median PE - or some other metric entirely - is the best metric to use for assessing Predictor performance. That assessment will, of course, depend on the purposes for which we intend to use those Predictors.
