Just For Kicks : An Analysis of the Kicking Statistics in AFL
/In his latest blog, Andrew considers the predictive power of the kicks statistic ...
One of my previous posts on the AFL game statistics included the observation that the team registering more kicks wins just under 80% of games. Today, we look a little closer at the kicks statistic.
Once again the data set is the games from 2001 to 2012 with the kicking statistics sourced from the AFL website. That’s 2,247 games (with 7 dropped because of missing statistics).
Win-Loss Table
The following table shows the relationship between a team's kicks and their winning (or losing). Games are classified on the basis of whether the away team or the home team recorded the greater number of kicks in the game (the columns) and whether the game was a home team win or an away team win (the rows). An equal number of kicks is treated as the away team kicking more (only 25 instances in 12 years), and a draw is treated as an away team win (22 instances).

The interpretation of the results is simple. The team that registers the greater number of kicks in a game is more likely to win. That's true for 79.3% of games.
Focussing on the columns we can see that home teams do a little better than away teams when they register the greater number of kicks. They win about 81% of the time (1,055 / 1,307) when they do this, but when the away team does it they win only about 77% of the time (727 / 940).
A few points for clarity:
- The number of kicks is known only at the end of the game so you can’t use the statistic for predicting the game outcome, e.g. if you happen to be running the MAFL betting system. For this post, the objective is to explore the game kicking statistics and their relationship to winning and losing in the hope that it sheds some light on how to improve existing models.
- The results do not demonstrate that the relationship is causal. However, watching a single game is enough to suggest that kicking is at least a good contributor to winning.
- The results say nothing about which kicks are “good” in the sense of contributing to a win.
But I’ll throw good statistical caveats to the wind and say that, at a professional level, registering more kicks than the opposition is a good thing.
In post-game interview language: “The boys done good. We played a good kicking game. We gave it 110%. </cliché>”.
By the Years
The table below provides the same analysis on a year-by-year basis (with the final row matching the table above).

The relationship between the team registering the greater number of kicks and the winning side has remained strong through the 12 years. In 2003 the relationship was at its strongest, with 85.4% of teams that registered the greater number of kicks also winning the contest. The low point was in 2009 when the proportion was just 73.2%. Across the 12 seasons the standard deviation is 3.3% points.
The following graph shows the per-game average of home and away team kicks over the same period.
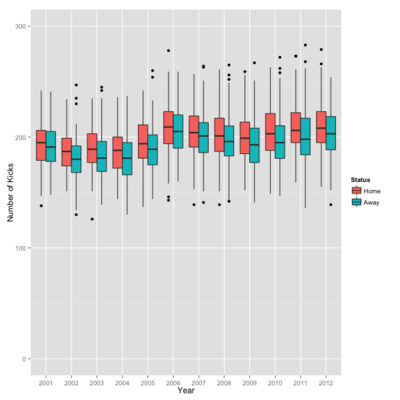
Each year, on average, home teams consistently out-kick away teams. As we know from other MAFL posts, home teams also win more often (56.4% of the time over these 12 years).
The chart also shows gradual changes over the years in the number of kicks per game. The low was in 2004 with a combined home and away team average of 366.9 kicks per game, and the peak was in 2012 with an average of 412.0 kicks per game.
That’s roughly a 10% increase which I suspect is an important change in AFL’s tight, professional competition.
(Trends in game styles as reflected in game statistics is a topic worthy of a deeper look in the future.)
Win-Loss Table with Bias
Are kicks of equal value for home and away teams? One way to assess this is to determine how many more (or fewer) kicks an away team needs to make than the home team in order to be more likely to win. I'll call this the home team bias and I'll determine an optimal bias for each season by finding the bias that, when applied to all games in a particular season, maximises the predictive accuracy of the heuristic:
Predict Home team win if Home team kicks + Bias > Away team kicks.
The results for every season from 2001 to 2012 appear in the table below.

A positive bias means that the home team needs fewer kicks to have a 50/50 chance of winning. This is found for 8 of the 12 seasons. Three seasons have a kick bias towards the away team and there’s one year where the optimum bias is zero.
With the exception of 2009, the bias is small - in the range of -7 to +7. Considering that the standard deviation of kicks per team per game is 22 over this same period, this bias seems modest.
In that context, the bias of +24 in 2009 indicates a surprisingly large benefit for the home team for kicks in that season. I don’t know AFL well enough to provide an explanation for this apparent anomaly or to comment on whether it may simply be an artefact of the data.
The optimal bias over the 12 years is +6, which suggests that home teams enjoy a small advantage in terms of the rate at which they convert kicks to points. However, applying this bias provides only a 0.4% point lift in the accuracy with which we can "predict" the winning team based on game kicking statistics alone (ie we only see a 2.1% reduction in errors). That difference amounts to just 10 games over 12 years.
On a year-by-year basis, the improvements are up to 6% points in size with an average improvement of 1.9% points. Put differently, that’s about a 9% error reduction, which is a healthy improvement in the model. Determining the appropriate, optimum bias to apply in future years is difficult, however, because of the historical variability of this optimum across seasons. (Perhaps an in-season analysis would shed more light on the stability of the optimal bias within a season.)
As something of a curiosity I note that the greater the bias (in absolute value terms) in a season, the larger the improvement in accuracy when that bias is applied (r=0.82).
Density Curves
The figure below shows the density curves of kick differences (home kicks less away kicks) for games won by the away team (shaded red) and for games won by the home team (shaded blue).
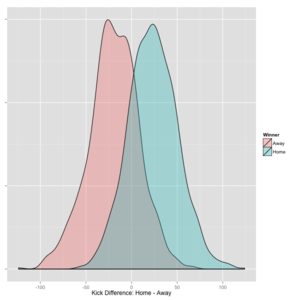
As you'd expect, the majority of games won by home teams show positive kick differences, while those won by away teams show negative differences, though there are a few examples of games where differences as large as 50 kicks in the "wrong" direction have still resulted in wins.
The density curves cross just right of zero. This corresponds to the bias of 6 kicks identified in the previous section.
The clear separation of the curves reflects the high correlation between kick difference and win/loss outcome (ie the 79.3% accuracy); the overlap area is where the 20.7% errors occur (ie where the team within the greater number of kicks loses the contest).
It's interesting to note that, in the most extreme cases, a team can have as many as 100 more kicks than its opponent.
This same data can instead be presented in the form of a cumulative density function, which might be easier for some to read.
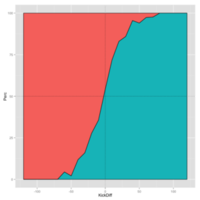
The line separating the red and blue sections in the chart maps the probability that the home team wins for a given kick difference.
So, for example, when the kick difference is zero, the home team has a slightly better than 50% chance of victory. It's about 50% when the kick difference is -6.
Out-kicking an opponent by 50 or more kicks, the chart shows, virtually guarantees a team win, whether they're at home or away. In only 13 of 419 games (or about 3%) was a team able to win with a 50+ kick deficit.
The same data, in tabular form, appears in the table that follows.

Here you can see that no home team has succeeded after allowing its away team opponents 70 or more additional kicks, and that no away team has prevailed when allowing its home team opponents 80 or more additional kicks.
You can also see that, when kicks are about equal, the home team wins a little over 54% of the time, and that home team wins increase less rapidly with kick differences greater than zero than they decrease with kick differences less than zero.
For example, a 30 kick deficit for the home team drops its winning rate down to just under 16% (about a 38% point drop from the 54% win rate it achieves with equal kick numbers), whereas a 30 kick surplus elevates its winning rate to just under 86% (less than a 32% point gain).
For home teams then, more kicks mean more victories, but fewer kicks means even fewer victories.
Are More Kicks Better?
So, the obvious conclusion is that kicking more means winning more, especially for home teams. But, there is something better to strive for.
For starters, the correlation between home team and away team kicks is only -0.16, which means that, as one team kicks more, it has only a mildly negative impact on the kicking of its opponent.
For the following table I've fitted a range of linear regressions to explain specific game metrics as a function of the kicking statistics of the home and the away teams.

Models 1 & 2 shows that the number of kicks by a team is a modest predictor of that team's score, while Models 3 & 4 shows that the number of kicks by the opposition team is actually a slightly better predictor! Naturally, the score of a team is reduced by the number of opposition kicks.
It's no surprise that models 5 & 6 improve the prediction of home and away team scores by incorporating the number of kicks by both teams. The coefficients for these models are very similar, and suggest that a team's final score is reduced by about 1 point for every 2 kicks that its opponent makes, and increased by about 1 point for every 2 kicks that it makes.
Also, the coefficient on opponent kicks is slightly larger in absolute magnitude that the coefficient on own kicks, which supports the contention from the previous section that restricting the opposition's kicks is a key step to winning.
Since we have some ability to predict the home and away scores using only kick statistics we might expect to be able to predict the total score for a game (ie home plus away score), right?
Well, no. Model 7 shows that the number of kicks by the two teams are, together, very poor at predicting the total game score, with only 0.3% of variation explained. More kicks do not make for a high scoring game, nor do fewer kicks make for a lower scoring game. (It turns out that the total game score is very difficult to model even using a wider range of game statistics.)
Model 8 has the highest correlation of any in the table. It models the game winning/losing margin, so it’s also most informative for predictive purposes. It gives a correlation of 0.74 between fitted and actual values, which means that it explains a little over one-half of the variability in score difference, using as regressors only the number of kicks registered by the two teams.
As a comparison, the equivalent of Model 8, but using handballs instead of kicks, yields a correlation of only 0.04! Kicks are hugely more associated with winning than handballs. (This replicates the finding of an earlier post on games stats and season outcomes.)
Finally, Models 9 & 10 model the score difference as a function of only the home or of the away team kicks. Kicking more does increase a team's chances of winning, but the reduced accuracy of this model compared with Model 6 shows that what matters is kicking more than your opponent rather than just kicking more, regardless.
Conclusion
Making more kicks than an opponent results in a win about 80% of the time, whether you're a home or an away team. Kicking more yourself but allowing the opposition more kicks as well, is a less effective strategy.
These results apply not just to a single game, but over the long term as well (at least for the analysed years of 2001-2012).
Implicit in this analysis is the belief that teams attempt to make more “good” kicks. Previous posts have demonstrated that inside 50s and marks inside 50 are highly correlated with success in games and in seasons. Goals are good too! So “good” kicks at least include kicks that result in inside 50s, marks inside 50 and goals. Winning teams will also reduce the number of “good” kicks made by an opponent.
As noted in an earlier post, kicks are more important to game outcomes than to season outcomes. This points, yet again, to the need to look at game stats in the context of an Offence-Defence Model (Tony introduced ODM to MAFL last year).
Finally, a call for data. Is there a database that includes kicks and other game statistics for each quarter or half? Some tests of interest:
- Can mid-game stats improve in-running betting models? (i.e. do kicks contain information not encoded in the mid-game scores).
- Is kicking performance consistent through a game? Shifts in statistics could shed light on the value of coaching and shifts in tactics.
Appendix
Still reading?!
You might be wondering: are we dealing with Normally-distributed data? The figure below shows the density graph for the key variables from this post (with mean and standard deviation provided within each chart).

The QQ plot provides a better view of the distribution compared to a perfect Normal distribution.
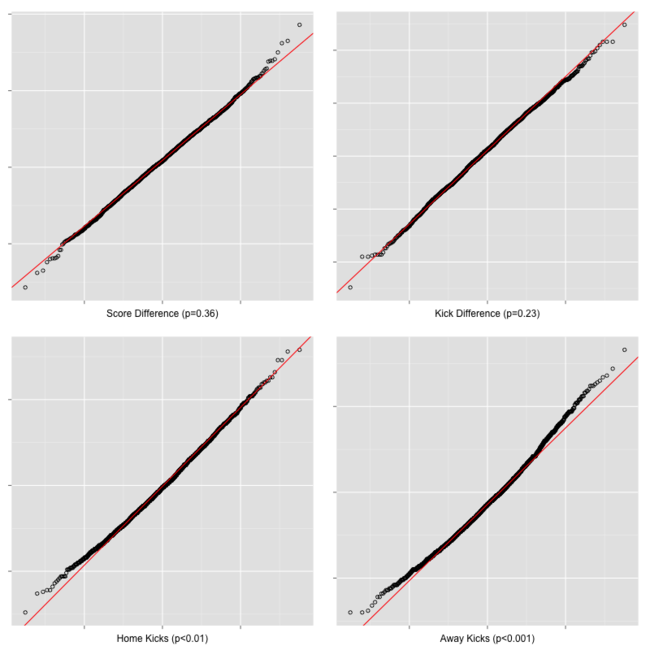
It confirms the broadly Normal nature of the distribution of home team and away team kicks across games. (The p-values, in brackets, are from Shapiro-Wilk tests for Normality).
All up, Normality seems to be a pretty reasonable modelling assumption for home and for away team kick data.
