MARS Rating Changes and Scoring Percentages: 1897-2013
/The idea for this blog sprang from some correspondence with Friend of MAFL, Michael, so let me start by thanking him for being the inspiration.
Michael was interested in exploring the relationship between teams' on-field results over a period of time, say a season, and the change in MARS Ratings that resulted. For the purposes of this blog I'm going to summarise a team's on-field performances for a season on the basis of the for-and-against percentage it achieved in all games including Finals. For the change in MARS Ratings I'll be using the difference between the MARS Rating that the team held prior to the first game of the season and the MARS Rating it held after the last game of the season. (For those of you following along with the development of MARS, I'm using the latest version of all-time MARS Ratings in which, you might recall, I treat the higher Rated team as the home team in Finals.)
TEAM-BY-TEAM VIEW
Firstly, here is the picture for Adelaide. It's clickable, as are all other charts in this blog.

In this chart each season is represented by a single point on the chart labelled with the relevant year. Points are colour-coded according to era, and the blue line traces a loess best-fit to the underlying data with the grey zone providing a 1 standard deviation measure of confidence around that line.
A very strong relationship between Adelaide's per game change in MARS Rating for a given year and its on-field performance in that same year as measured by its for-and-against percentage, is apparent. Quantified, the correlation is +0.928.
We can see from this chart that Adelaide's best ever scoring percentage was attained in the 2006 season, while 2012 was the year in which it grew its MARS Rating most per game. Conversely, its worst ever percentage came in 2011, and its poorest performance in terms of MARS Rating decline per game came in 1995.
The 2006 season is also noteworthy for Adelaide in that the strong for-and-against percentage resulted in a much smaller MARS Rating per game than the overall relationship between these two variables would suggest might have been expected. This is partly because Adelaide went into the season Rated almost 1,017, which meant that it didn't benefit as much in terms of Ratings Points from some of the large losses it inflicted on weaker opponents.

For Brisbane (which includes the Brisbane Bears and the Brisbane Lions), the overall pattern is similar, though we see more years of Rating declines and a flattening of the relationship between Rating decline and for-and-against percentage at the lower end.
Brisbane's best season, both in terms of for-and-against percentage and Rating change per game was 1999, which was season in which the Lions lost in the Preliminary Final to the Roos, who went on to win the Flag. The next 5 years, from 2000 to 2004, were also above-average years for Brisbane.
From a scoring viewpoint 1992 was the Lion's nadir, while from a Ratings perspective it was 1998.
Brisbane has a handful of seasons that lie a relatively long way off the curve, perhaps most notably 2004 and 2005, both seasons in which the Lions started the year Rated about 1,021. They, like Adelaide, were therefore expected to dole out some of the drubbings that they did in those years and so grew their Rating by less than they might have otherwise.

Carlton has a much longer - and, as a consequence, numerically more varied - history than either Adelaide or Brisbane.
Their dominance of much of the early part of the 20th Century is borne out by the slew of red years in the upper right section of the chart. In particular, their 1908 for-and-against performance stands out, notwithstanding that it was crafted from a season of only 20 games.
The Blues' best ever performance in terms of Ratings increase per game came in the 1979 season, in which they won the Flag having lost only 3 games all season including one in the home-and-away season against the Pies, who they would eventually defeat in the Grand Final.
The latter part of the 19th Century and the early part of the 21st Century represented harsher times for the Blues as they recorded their lowest ever percentage in 1901 and their largest Rating decline per game 101 seasons later in 2002.
Their 1899 performance stands out as being the year in which their inability to score cost them relatively little in terms of Ratings. In that year they entered the season Rated just under 985 and played only 17 games, scoring 280 points fewer than they conceded. Almost 20% of that points deficit was surrendered in the first game of the season, however, as they went down 73-18 to South Melbourne. In Ratings terms it's generally better to lose one game by a lot rather than a number of games each by smaller but, in aggregate, an equivalent margin. This is especially true if you can record the large loss while your Rating is relatively low compared to your opponent's.
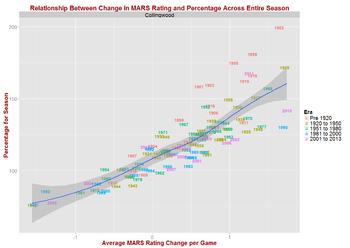
Collingwood is another team with a long though in their case far-less varied history - at least in terms of sub-par performances.
Their most extraordinary point-scoring performances came in seasons from the late-19th and early-20th Century, though their 2011 numbers also impress.
1902 saw them achieve their highest scoring percentage and also saw them win the Flag after losing only 3 games all season, including a Semi-Final loss to Fitzroy. Under the curious rules of the time, the Pies, as Minor Premiers, were entitled to repercharge the winner of the Preliminary Final in a Grand Final, which they did, facing Essendon and prevailing.
The Pies' poorest seasons both in terms of scoring percentage and MARS Rating decline per game were 1942 and 1987. The performance in 1942 was very marginally poorer than that of 1987, but the metrics for these two seasons are so similar that, for practical purposes, they're identical. In both seasons the Pies' scoring percentage was about 75. It's a strong team indeed that, in its worst ever season, still scores on average about three-quarters of the points that it concedes.
Along with their notably not bad worst performances, the Pies are also characterised by the overall weaker relationship between the changes in their MARS Rating and their scoring percentage. For them, the correlation is only +0.838 - still high in absolute terms, but the lowest of all the teams.

Essendon's another of the teams with a long and complex narrative. They recorded their best scoring percentage in 1898, and their next two bests in 1901 and 1911, while racking up their highest Rating change per game in their almost all-conquering 2000 season, during which they won the Flag after losing only a single game: their Round 21 contest against the Bulldogs.
For a team with such a lengthy history the Dons have relatively few truly extraordinary seasons. In only six seasons have they recorded a percentage above 150, and only twice have they squirreled more than 1.5 Ratings Points per game.
They do though have their fair share of underperforming seasons, the worst of them, from a scoring percentage viewpoint, 1918, in which they finished with about a 64 percentage from 14 uninspiring games, winning just 3 and losing 11.
The 1933 season was their worst season in terms of Ratings decline per game played. They started that year Rated 999.4 before shedding 27.5 Ratings Points over just 18 games.

Fitzroy, the first of the two now defunct teams I'll cover in this blog, arranged to complete virtually all of their most successful seasons before the end of WWII.
Their best scoring percentage came in 1903, a season in which they finished as Runners Up to Collingwood in losing the Grand Final 29-31, and their prime season for Ratings building was 1915 where they piled on almost 23.5 Ratings Points in only 18 games, going out in a Preliminary Final to the eventual Premiers, Carlton.
Fitzroy's worst season - in very many ways - was their last, 1996, in which they went 1 and 21 with a sub-50 percentage and shed almost 53 Ratings Points in so doing at a rate of more than 2.4 Points per game. They did this having commenced the season with an already parlous Rating of just under 966.5, which makes the size of their Points shedding even more impressive.

Next is Fremantle, a team with a short history and with the best of that history only just behind it.
The most recent season, 2013, saw them record their best ever scoring percentage, while the season before that saw them accumulate the largest number of Ratings Points per game.
1998, a season in which they won only 7 of 22 home-and-away contests, was their worst season for Ratings decline per game, while 2000 and 2001 were all-but equally dire in terms of scoring percentage. In 2000 their final percentage was 72.04, and in 2001 it was 72.02.
Of all the teams with more than a handful of seasons in their past, Fremantle are the team with the highest correlation between scoring percentage and Ratings change per game. Theirs stands at +0.947.

Geelong are another team with a long and storied history. Their very best seasons came partly in the most distant past and partly in more recent times, their best scoring percentages having been recorded in 1897 and 1899, while their largest accumulation of Ratings Points per game came about in the 2007 season, at the end of which they also won the Flag.
Seasons 2008, 2010 and 2011 were also relatively good for the Cats in terms of both metrics.
1915 saw the Cats recording their worst performance in terms of Ratings Point decline per game (they finished last with a 3 and 13 record), while 1944 was worst in terms of scoring percentage (they finished last, again, with a 1 and 17 record and a sub-59 percentage).
Geelong, as many other of the teams with longer histories, appears to have an S-shaped relationship between MARS Ratings change per game and season scoring percentage. We'll come back to this phenomenon later in the blog.


Neither the Gold Coast nor GWS have long enough histories to provide for any meaningful commentary. I include them here for reasons of completeness only.
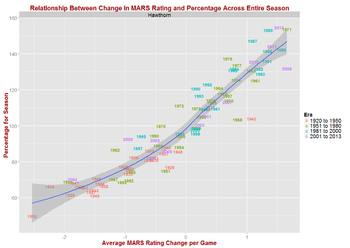
After the two newest teams we come to Hawthorn, another team with an extended history.
Four of their best dozen-and-a-bit seasons have come since 2008, with 2008 representing the team's best ever rate of accumulation of Ratings Points per game (1.6581 Ratings Points per game across 25 games, barely nudging out the 1.6580 of 1971). 2008 was also a year in which the Hawks won a Flag.
Their highest scoring percentage came in 2012, a season in which they outscored their collective opponents by about 1.55:1 and in which they finished surprise Runners Up to the Swans in the Grand Final.
The Hawks' worst year came in 1950 when they registered their only ever sub-50 percentage during the home-and-away season and shed over 2.5 Ratings Points per game at the same time.
The 1943 season was probably their most odd in terms of the metrics that we're considering in this blog, their unremarkable 103.9 scoring percentage proving sufficient to pouch them over 16 Rating Points in just 15 games (of which they won just nine, though including two where they prevailed over the eventual Grand Finalists, which might go some way to explaining the rich harvest of Rating Points they enjoyed from what appears to be a very average season).

Next come the Roos (aka North Melbourne), whose best season for Ratings increases per game and scoring percentage came almost 40 years ago in 1974. In that year the Roos finished 16 and 6 in the regular season, going on to lose to Minor Premiers, Richmond, in the Grand Final.
Their next-best seasons came in the mid 1990s and the late 1940s, though 2013 could legitimately be included amongst their 10 or so all-time best seasons. (I've chronicled at length elsewhere the evidence that the Roos' final ladder position in 2013 bore little resemblance to their apparent strength.)
The late 1920s and early 1930s produced some of the Roos' worst seasons, 1930 and 1931 representing the trough with scoring percentages barely above 50 and Ratings losses of around 2.1 per game.
The good news for the Roos is that they haven't turned in a truly lower quartile performance since 1984 when they went 5 and 17, finishing second-last with an 82 scoring percentage and dropping over 1.3 Ratings Points per game.

Which brings us to Melbourne, whose glory-days pre-date the current century.
Their best year in terms of both scoring percentage and Ratings increase per game was 1955, a year in which they went 15 and 3 in the home-and-away season before proceeding to win the Flag by more than 4 goals in a Grand Final against the Pies, who were Runners Up in the home-and-away season.
1919 was the Dees' worst ever season according to the analysis here, an assessment that seems eminently reasonable when it's framed by the 0 and 16 home-and-away season performance and the 43 scoring percentage that they recorded in that year.
Last year's performance was, based on these same metrics, their third-worst ever. Having witnessed some of it first-hand, that's also an assessment that's hard to fault.

Port Adelaide are another of the more-recent competition entrants, yet they too exhibit a reasonably strong, linear relationship between Ratings change per game and scoring percentage.
Their best season on both metrics came in 2004, a season which also saw them win the Flag. The three preceding seasons were also among their best, though they managed only two losses in Preliminary Finals and one in a Semi Final during that time.
2011 was, comfortably, their worst season. In that year they finished second-last with a 3 and 19 record, ahead only of the newly-minted Gold Coast franchise, registering a 64.5 percentage and shedding almost 1.8 Rating Points per game.
It's interesting to note that the only seasons in which Port Adelaide have recorded scoring percentages above 100 are the same and only seasons across which they've accumulated Rating Points.

One Tigers supporter that I know has quipped that Richmond have been at the start of a 5-year building phase for the last 30 years, a sentiment that is borne out by the Tigers' chart, at left, which shows no real seasons of note - bar perhaps the last two - since 1982.
Even that season will be remembered with considerable regret by the Tigers faithful since the year saw Richmond go down to the Blues in the Grand Final after having secured the Minor Premiership during the home-and-away season with an 18 and 4 record.
2004 was Richmond's worst season in terms of Ratings Point losses per game, while 1909 saw the Tigers record their all-time worst scoring percentage (64.4 percent).
On balance, Richmond appear to have had slightly more above-average seasons than below-average ones, but they've only 10 Flags to show for their longevity - and 11 Grand Final losses.

If you're assessing pain levels for team supporters, however, you'd find it challenging to identify a more battered group of supporters than those of the early Saints teams.
Some of St Kilda's worst performances came in the first six years of their existence, the absolute worst in terms of Rating decline per game coming in 1897 and the worst in terms of scoring percentage coming in 1899.
More-recent seasons have been far kinder, the best of them being 2009 in which the Saints went 20 and 2 in the regular season, securing the Minor Premiership as a result, before eventually losing to the Cats by 2 goals in a Grand Final they could easily have won.
Prior to that, the 1963 and 1970 seasons were amongst St Kilda's best.

In recent times, Sydney's (aka South Melbourne's) best season was 2012, though they've had two seasons - 1933 and 1942 - where they've secured more Ratings points per game (they won one Flag and lost in a Preliminary Final in those years) and four seasons - 1909, 1912, 1918 and 1919 - where they've finished with a superior scoring percentage (they won two Flags and were a losing Grand Finalist during those four seasons).
Some of the Swans' worst seasons came during the early 1960s and 1970s, though their all-time worsts were in 1903 when their scoring percentage was 54.9 and they finished last in the regular season with a 2 and 15 record, and in 1990 when they shed almost 2.1 Rating Points per game and ended the regular season in second-last position with a 5 and 17 record, ahead only of the then Brisbane Bears.
Since 2001, Sydney have put together an impressive string of seasons. Only once, in 2009, have they finished the season with a sub-100 percentage or with a net Ratings decline.

University are another team with only the barest of histories, having participated in just seven seasons spanning the period from 1908 to 1914.
They finished seasons with scoring percentages above 100 and having lifted their MARS Rating only twice, once in 1909 and again in 1910. On both those occasions, the margin by which they exceeded those fairly arbitrary "above average" benchmarks were tiny: in 1909 their scoring percentage was 100.11 and they gained 1.04 Rating Points in total across the season; in 1910 their percentage was 101.5 and they snared just 0.92 more Rating Points than they surrendered during the season.
Of all the teams that have played more than just a few seasons, University have the highest correlation coefficient between Ratings increase per game and scoring percentage (+0.977).

By far, the Eagles' best season in terms of scoring percentage was 1991 when their 19 and 3 home-and-away season record was sufficient to secure them the Minor Premiership on the way to finishing Runners Up to the Hawks in the Grand Final.
This season was also the best in terms of Rating Points accumulation per game, the 1.47 result very narrowly eclipsing the 1.44 Rating Points per game increase achieved in 2011 when the Eagles went out in the Preliminary Final to eventual winners Geelong.
2008 was the Eagles' worst year. They shed over 2.1 Rating Points per game during that season and finished with a 65.9 percentage and a 4 and 18 win-loss record.
Their 2001 season was only marginally better, producing a net loss of 1.7 Rating Points per game, a 66.0 percentage and a 5 and 17 win-loss record.
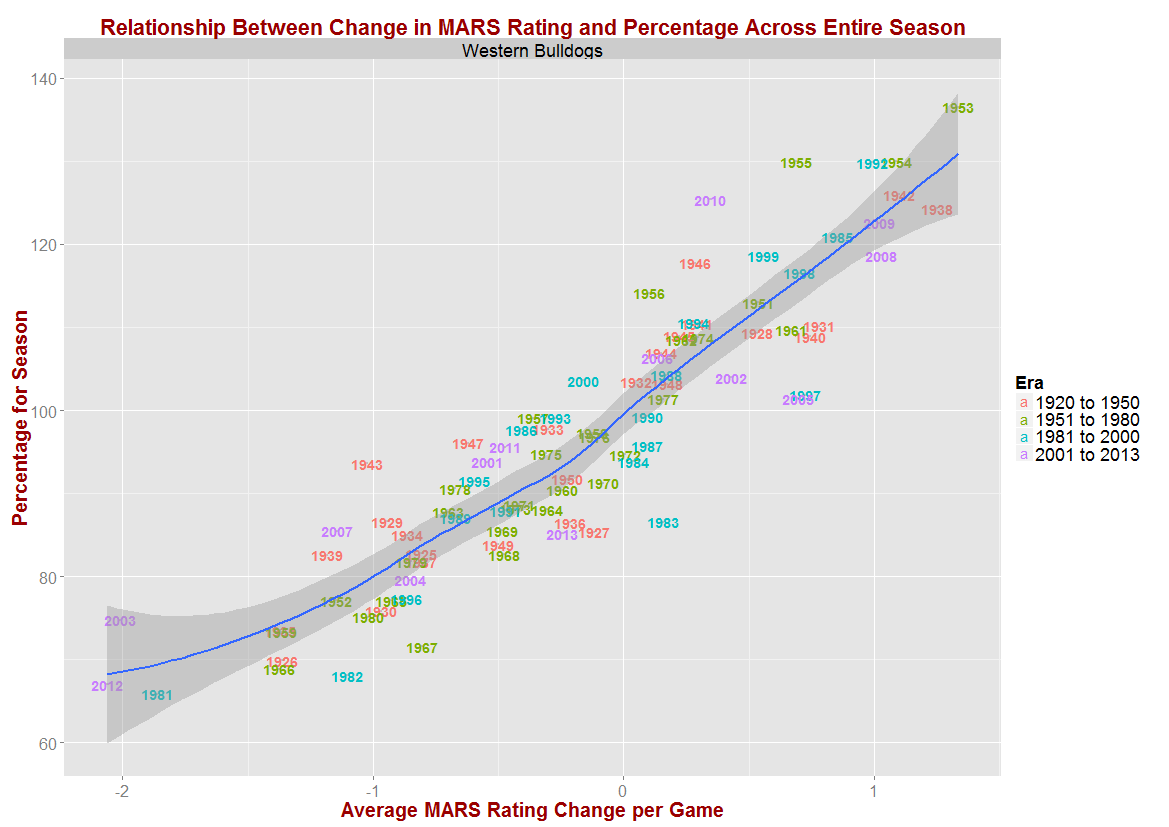
Lastly we come to the Western Bulldogs (aka Footscray) whose fortunes have been very mixed over recent seasons with seasons 2008, 2009 and 2010 amongst their best, and seasons 2003, 2004, 2007 and 2012 amongst their worst.
The absolute best season, however, based on the metrics we're using in this blog, was 1953 in which the Dogs recorded a 136.5 scoring percentage, netted over 1.3 Rating Points per game - and went out in the Preliminary Final to the Cats. (The Dogs won the Flag in the next year, 1954, starting the clock on the now-longest streak of Flagless seasons of any of the teams in the competition. Since 1954, the Dogs have come close only once, losing in the 1961 GF to Hawthorn after leading at the main break.)
Their worst seasons have been 2012, in which they recorded their largest Rating Points loss per game in going 5 and 17 for the year, and 1981 where they recorded their smallest scoring percentage in going 2 and 20.
A COMBINED VIEW
From the team-by-team views it's clear that the relationship between scoring percentage and Ratings increase per game is strong and positive and, except perhaps at the extremes, linear. Combining the data in one chart for all teams and all seasons supports this contention.

One striking feature of this chart is the preponderance of data from the Pre 1920 era (ie the red dots) in the extremes of scoring percentages. Typically, these seasons were shorter and mostly low-scoring affairs, characteristics that allowed teams to record very low and, especially, very high scoring percentages across entire seasons.
Of the 43 teams that have completed a season with a scoring percentage in excess of 150, 26 of them were teams that played before the 1920 season, and, of the 36 teams that completed a season with a scoring percentage below 60, 19 of them came from that same era.

As one way of investigating the effects of including games from the earliest era in the overall data, let's look at the relationship between scoring percentage and Ratings change per game by era.
Just how different those first 25 or so seasons were is made very apparent by this chart. What's also made clear, however, is how broadly similar the seasons have been since then.
For eras other than the Pre 1920 era there does still seem to be a slight curvature in the relationship between scoring percentage and Ratings change, but it's only a slight one.
In fact, if we feed the data for all teams and all seasons from 1920 onwards into Eureqa it comes up with the following very simple linear solution, which explains 84.5% of the variability in scoring percentages:
Scoring Percentage = 103.2 + 22.69 x Ratings Change per Game
The next-most complex solution that it offers incorporates the merest hint of non-linearity, and explains only another 0.6% of the variability:
Scoring Percentage = 102.4 + 23.27 x Ratings Change per Game + Ratings Change per Game2
Bearing in mind that roughly 90% of values for Rating Change per Game for teams competing in the seasons after 1919 lie in the range -1.57 to +1.32, the last term in this equation adds, at most, about 2.5 to the fitted Scoring Percentage. That's very small compared to the contribution of the middle term, which provides the linearity and is about 15 times as large at the extremes.
SUMMARY AND CONCLUSION
The overwhelming conclusion from this analysis is that a team's net change in MARS Rating per game across a season is highly positively correlated with its scoring percentage for that same season. For many teams the relationship appears to be linear, or very close to it, across the entire range of scoring percentages and Ratings changes per game, although a few teams show signs of a flattening of the relationship at the extremes, mainly for seasons from the very early portion of VFL/AFL history.
If we ignore seasons prior (roughly) to the end of WWI, the relationship between Ratings change per game and scoring percentage is well-modelled by a simple linear equation.
