Finding Non-Linear Relationships Between AFL Variables : The MINER Package
/It's easy enough to determine whether or not one continuous variable has a linear relationship with another, and how strong that relationship is, by calculating the Pearson product-moment correlation coefficient for the two variables. A value near +1 for this coefficient indicates a strong, positive linear relationship between the variables in question, so that high values of one tend to coincide with high values of the other, and vice versa for low values; a value near -1 indicates a strong, negative linear relationship; and a value of 0 indicates a lack of any linear relationship at all.
But what if, more generally, we want to assess if there's a relationship between two variables, linear or otherwise, and we don't know the exact form that this relationship takes? That's the purpose for which the Maximal Information Coefficient (MIC) was created, and recently made available in an R package called MINER.
(You can read about the MIC metric and the MINER package approach in this document and by following the links in the previous reference).
For this blog I've used the MINER package to investigate the relationships between a range of football-related variables including game results, Home and Away team scores, TAB Bookmaker prices, venue status and MARS Ratings. As well as looking at these variables in their raw forms I've also created new variables, derived by combining these base variables or by applying mathematical functions to them such as square roots, absolue values and logs. These new variables are, in some cases, just different ways of expressing the same measure and, in other cases, attempts to create additional measures of some specific feature such as relative rather than absolute team strengths.
Here's the full list of variables we'll be investigating:

These variables have been sourced or created for all games spanning the period 2000 to 2011, though I've also analysed only the period from 2006 to 2011 as this is the period for which I have most confidence in my TAB Bookmaker prices.
In analysing these variables I'm hoping to determine:
- Whether there's a relationship between the TAB Bookmaker prices and team MARS Ratings
- Whether there's a relationship between game outcomes and TAB Bookmaker prices, and between game outcomes and team MARS Ratings. If so, which relationships are the stronger
- How well the MINER package is able to recognise the non-linear relationships between the variables I've created and their raw forms
I'm hoping that a few unexpected and interesting relationships might show up too.
MINER's Ability to Detect Manufactured Non-Linear Relationships
Let's first see how well MINER is able to dispatch the length deliveries into the grandstand (or the soft pitches into the bleachers if you're reading this from a country steeped more in baseball than in cricket). Here's a table of the relationships MINER found that involve the raw variables and their derivative measures.
(Please click on this image, and any of those that follow, for larger versions.)
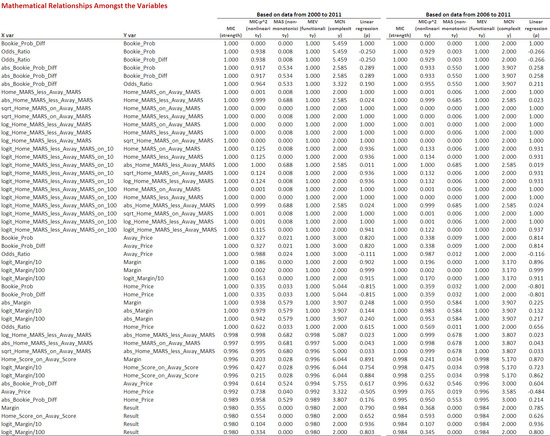
Each row of the table represents the results that MINER produced for a given pair of variables. The first row, for example, relates to the relationship between the Bookie_Prob_Diff and Bookie_Prob measures. MINER provides a range of measures describing the relationship it's detected between each pair of variables:
- MIC (strength) : describes the strength of the relationship between the variables on a scale from 0 (no relationship) to 1 (perfect relationship)
- MIC - p^2 (non-linearity) : describes the extent to which the relationship detected is non-linear in nature (p^2 is the value of the Pearson Product-Moment Correlation Coefficient). A value near 0 indicates a strongly linear relationship while large values indicate strong, highly non-linear relationships
- MAS (non-monotonicity) : describes the extent to which the discovered relationship is non-monotonic in character (ie has bumps or sharp edges). Values nearer to 1 indicate more non-monotonic relationships
- MEV (functionality) : describes the extent to which the relationship is "close to" or can be described by a function. Values nearer 1 indicate relationships that are more function-like (and thus, for example, more likely to be detected by a tool such as Formulize)
- MCN (complexity) : provides a measure of the complexity of the relationship uncovered, with larger values indicating more complex relationships
- Linear regression (p) : provides the value of the Pearson Product-Moment Correlation for the two variables, and thus provides a measure of the strength and direction of the linear relationship, if any, between them
The MIC values in this table are all 1 or very near to it, showing that the MINER package has done a solid job of recognising and recovering the underlying mathematical relationships amongst the variables. We could quibble about some of the Complexity values, but that's more a matter of opinion than a demonstrable failure.
Noting how MINER characterises some of these known relationships is a useful way to understand how to interpret its results for later relationships. Consider, for example, the row for abs_Home_MARS_less_Away_MARS and Home_MARS_less_Away_MARS. If you were to map this relationship it would trace out a V shape, rising in both directions from the origin at 45 degrees. For this relationship MINER outputs an MIC of 1 denoting a perfect relationship; calculates MIC - p^2 as 0.999 indicating that the relationship is strongly non-linear; offers an MAS of 0.688 which suggests that the relationship is highly non-monotonic (which it clearly is); shows an MEV of 1 indicating that the relationship is well described by a function (whose name, we know, is 'absolute value'); provides an MCN of 2.585 suggesting that the relationship is moderately complex; and records the fact that the linear correlation between the two variables is just 0.024.
Were we to rely solely on the linear correlation coefficient here we'd conclude that there was no (linear) relationship between the pair of variables, which while true misses something important. Clearly there is a useful and strong relationship here; and clearly MINER found it and described it well.
Relationships Between the Derived Measures and Their Constituent Variables
Moving up a level of complexity, and of interest, we next look at what MINER has to say about the derived measures (such as game Margin) and their constituent variables (in that case Home Score and Away Score).

For the most part I'll leave this table as one for you to review at your leisure and restrict myself to commenting on the fact that the relationship between game Margin and the Home team score is stronger than that between game Margin and the Away team score.
This suggests that, should I ask you to guess the Margin of a particular game and offer to tell you either the Home team's or the Away team's score in that game, you should ask me to reveal the Home team score as it contains more information about the game Margin. Note that this holds whether you look at all the seasons from 2000 to 2011, or just at seasons 2006 to 2011.
Relationships Between Bookie Prices and MARS Ratings
Now we start to answer some of the more interesting questions. A bookmaker's prices reveal his or her opinions about the relative strengths of the participating teams, as do my team MARS Ratings, at least purportedly.
Logically then there should be a relationship between Bookmaker Prices and MARS Ratings. The question here is: do these relationships exist and, if so, how strong are they?

The first 30 rows of this table are all saying much the same thing in terms of the existence and size of such a relationship. Whether we look at the raw Ratings data or the variables derived from these Ratings, and whether we look at the Bookie Prices for the individual teams or the difference between the team probabilities that these Prices imply, there is a moderately strong (MIC about 0.6), largely monotonic (MAS near zero) and quite complex (MCN 6.7) relationship between Rating and Price data which we should expect to be reasonably well described by a function (MEV about 0.6).
Remaining rows of this table describe weaker relationships. At first I was quite surprised to see how relatively weak were the relationships between Home team MARS Ratings and Home team Prices, and between Away team MARS Ratings and Away team Prices, but then I realised that Prices reflect relative, not absolute team strengths, and my surprise upped and left.
Relationships Between Bookie Prices, MARS Ratings and game Outcomes
Time to, once again, pit the MAFL MARS Ratings against the TAB Bookmaker's Prices and ask: which are better indicators of game outcomes?
In this table the rows shaded red relate to relationships between game outcomes and Bookmaker Prices, and those shaded green relate to relationships between game outcomes and MARS Ratings.

For these comparisons it makes more sense to focus only on the columns that relate to the data for seasons 2006 to 2011 as these represent the seasons with the best bookmaker price data. For this period, I'm pleased to say, MARS Ratings do a little better than Bookmaker Prices at explaining most metrics related to game outcomes.
For example:
- In explaining the game Margin, the ratio of the teams' MARS Ratings is a better predictor than is the Odds Ratio implied by Bookmaker prices (MIC of 0.274 vs 0.236).
- In explaining the game Result, the difference between the teams' MARS Ratings is a better predictor than is the Odds Ratio implied by Bookmaker prices (MIC of 0.251 vs 0.231).
- In explaining the ratio of the Home score to the Away score, the ratio of the teams' MARS Ratings is a better predictor than is the Odds Ratio implied by Bookmaker prices (MIC of 0.273 vs 0.258)
MARS Ratings are also more highly associated than are Bookmaker prices with the individual scores of the Home and of the Away teams.
The challenge now is to find the details of the relationship between MARS Ratings and game outcomes that these MINER results are hinting at. Looking at the row describing the relationship between the difference in team Ratings and the eventual game Margin - the second row of the table - suggests that the relationship is near linear, near monotonic, but possibly complex and only somewhat well-described by a function. I admit, I'm struggling to envisage what such a relationship might look like right now. More analysis is required.
Relationships Involving the Interstate Status Variable
Usually when I build models in Formulize and include the Interstate Status variable as a candidate, it manages to weasel its way into the final models, so I continue to be interested in its predictive pedigree. For this section I've tabulated MINER's outputs for variable pairs in which one of the pair is the Interstate Status variable.

The first thing to note is that the relationships shown here are all only weak. Strongest amongst them, for either time period, is the relationship between Interstate Status and the Rating of the Away team. Prime facie there's no reason for such a relationship to exist - the game venue doesn't enter into a team's MARS Rating calculation for an upcoming game. Also amongst the stronger of the relationships listed here is that between Interstate Status and the MARS Rating of the Home team.
It can only be the case that these relationships are statistical flukes or that the AFL's scheduling, by accident or by design, has induced them. Both relationships appear to be relatively linear and monotonic, though they're also complex and not well-described by functions. For now all I can say is that this result requires further investigation. Any suggestions you might have for what the relationship is and why it's come about would be welcomed.
(By way of further input into the discussion, I note that there's also a weak association between the MARS Ratings of the participating teams in each contest. Again there's no reason for such an association to exist a priori.

This finding could plausibly be the result of the AFL's scheduling of the draw to reduce the number of potential mismatches, as we discussed in an earlier review of the 2012 Draw.)
Back to the previous table and reviewing the rows shaded in red we can see that there's only weak association between Bookmaker Prices and Interstate Status. We also find that these relationships are generally linear, monotonic, but also complex and not well-described by a function.
Lastly, by looking at the rows shaded blue we can review the associations between the Interstate Status variable and variables related to the game outcome. We find only weak to very weak relationships, with MIC values ranging from near zero to just over 0.1. If the Interstate Status of a contest does has a bearing on its outcome, it's only a very small bearing.
Relationships Between the Team Scores
It's easy to imagine that there might be an association between the scores of the Home teams and those of the Away teams across a set of games, though we could postulate that the relationship might be positive if both team's scores are affected by common matchday conditions such as heavy rain, or might instead be negative if the overwhelming performance of the winner serves to depress the score of the loser and if, as is the case, the Home team tends to win more often than the Away team.
The MINER analysis shows that there is, indeed, a relationship between Home team and Away team scores, but it's a fairly weak one, perhaps because both of the situations I've described above prevail at different times and in varying proportions, which serve to temper the strength of any relationship.

