Why There'll Always Be More Blowouts Than We Expect

Last night I was thinking about the results we found in the previous blog post about upsets and mismatches and wondered if the historical pattern of expected game margins was borne out in the actual results. On analysing the data I found that there were a lot more victories of 10 Scoring Shots or more in magnitude than MoSSBODS had predicted. In most seasons, at least one-third of the games finished with a victory margin equivalent to 10 Scoring Shots or more, which was usually two or three times as many as MoSSBODS had predicted.

Read More

Predicting the Home Team's Final Margin: A Competition Amongst Predictive Algorithms

With fewer than half-a-dozen home-and-away rounds to be played, it's time I was posting to the Simulations blog, but this year I wanted to see if I could find a better algorithm than OLS for predicting the margins of victory for each of the remaining games.
Read More

A Friendly Wager on the Margin

You're watching the footy with a mate who leans over and says he reckons the Cats will win by 15 points. How much leeway should you give him to make it a fair even money bet? Surprisingly - to me anyway - the answer is 24 points either way. So, if the Cats were to record any result between a loss by 9 points and a win by 39 points you should pay out.
Read More

Introducing MAFL's First Neural Network

I've been leery of neural networks for some time because of their perhaps undeserved reputation for overfitting data and because of the practical difficulties that have existed in using them for prediction. Phil Brierly's Tiberius software includes an implementation of neural networks that has, at least for now, converted me. As a consequence, I'm adding one final margin predictor to the mix for 2011.
Read More

Margin Prediction for 2011

We've fresh tipsters for 2011, fresh Funds for 2011, so now we need fresh margin predictors for 2011. This year, all of the margin predictors are based on models that produce probability forecasts, which includes the algorithms powering ProPred, WinPred and the Head-to-Head Fund and the "model" that is the TAB Sportsbet bookmaker. The process for creating the margin predictors was to let Eureqa loose on the historical data for seasons 2007 to 2010 to produce equations that fitted previous home team margins of victory as a function of these models' probabilities.
Read More

Assessing ProPred's, WinPred's and the Bookie's Probability Forecasts

Almost 12 months ago, in this blog, I introduced the topic of probability scoring as a basis on which to assess the forecasting performance of a probabilistic tipster. Unfortunately, I used it for the remainder of last season as a means of assessing the ill-fated HELP algorithm, which didn't so much need a probability score to measure its awfullness as it did a stenchometer. As a consequence I think I'd mentally tainted the measure, but it deserves another run with another algorithm.
Read More

Adding Some Spline to Your Models

Creating the recent blog on predicting the Grand Final margin based on the difference in the teams' MARS Ratings set me off once again down the path of building simple models to predict game margin.

It usually doesn't take much.

Firstly, here's a simple linear model using MARS Ratings differences that repeats what I did for that recent blog post but uses every game since 1999, not just Grand Finals.

2010 - MARS Ratings vs Score Difference.png

It suggests that you can predict game margins - from the viewpoint of the home team - by completing the following steps:

  1. subtract the away team's MARS Rating from the home team's MARS Rating
  2. multiply this difference by 0.736
  3. add 9.871 to the result you get in 2.

One interesting feature of this model is that it suggests that home ground advantage is worth about 10 points.

The R-squared number that appears on the chart tells you that this model explains 21.1% of the variability is game margins.

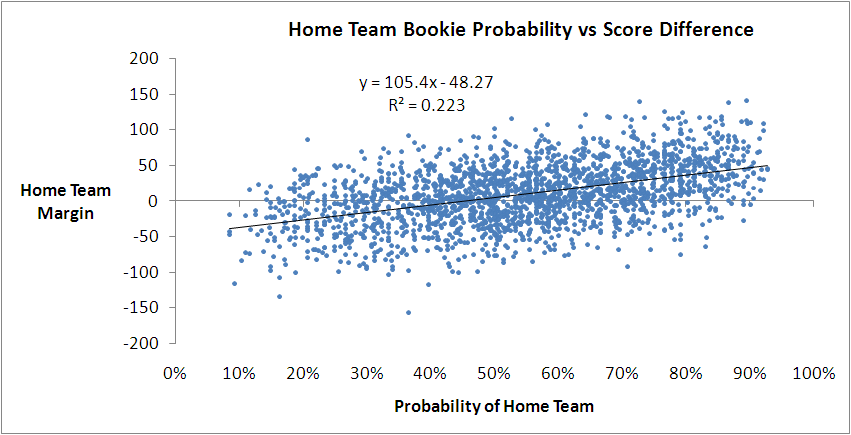
You might recall we've found previously that we can do better than this by using the home team's victory probability implied by its head-to-head price.

2010 - Bookie Probability vs Score Difference.png

This model says that you can predict the home team margin by multiplying its implicit probability by 105.4 and then subtracting 48.27. It explains 22.3% of the observed variability in game margins, or a little over 1% more than we can explain with the simple model based on MARS Ratings.

With this model we can obtain another estimate of the home team advantage by forecasting the margin with a home team probability of 50%. That gives an estimate of 4.4 points, which is much smaller than we obtained with the MARS-based model earlier.

(EDIT: On reflection, I should have been clearer about the relative interpretation of this estimate of home ground advantage in comparison to that from the MARS Rating based model above. They're not measuring the same thing.

The earlier estimate of about 10 points is a more natural estimate of home ground advantage. It's an estimate of how many more points a home team can be expected to score than an away team of equal quality based on MARS Rating, since the MARS Rating of a team for a particular game does not include any allowance for whether or not it's playing at home or away.

In comparison, this latest estimate of 4.4 points is a measure of the "unexpected" home ground advantage that has historically accrued to home teams, over-and-above the advantage that's already built into the bookie's probabilities. It's a measure of how many more points home teams have scored than away teams when the bookie has rated both teams as even money chances, taking into account the fact that one of the teams is (possibly) at home.

It's entirely possible that the true home ground advantage is about 10 points and that, historically, the bookie has priced only about 5 or 6 points into the head-to-head prices, leaving the excess of 4.4 that we're seeing. In fact, this is, if memory serves me, consistent with earlier analyses that suggested home teams have been receiving an unwarranted benefit of about 2 points per game on line betting.

Which, again, is why MAFL wagers on home teams.)

Perhaps we can transform the probability variable and explain even more of the variability in game margins.

In another earlier blog we found that the handicap a team received could be explained by using what's called the logit transformation of the bookie's probability, which is ln(Prob/(1-Prob)).

Let's try that.

2010 - Bookie Probability vs Score Difference - Logit Form.png

We do see some improvement in the fit, but it's only another 0.2% to 22.5%. Once again we can estimate home ground advantage by evaluating this model with a probability of 50%. That gives us 4.4 points, the same as we obtained with the previous bookie-probability based model.

A quick model-fitting analysis of the data in Eureqa gives us one more transformation to try: exp(Prob). Here's how that works out:

2010 - Bookie Probability vs Score Difference - Exp Form.png

We explain another 0.1% of the variability with this model as we inch our way to 22.6%. With this model the estimated home-ground advantage is 2.6 points, which is the lowest we've seen so far.

If you look closely at the first model we built using bookie probabilities you'll notice that there seems to be more points above the fitted line than below it for probabilities from somewhere around 60% onwards.

Statistically, there are various ways that we could deal with this, one of which is by using Multivariate Adaptive Regression Splines.

(The algorithm in R - the statistical package that I use for most of my analysis - with which I created my MARS models is called earth since, for legal reasons, it can't be called MARS. There is, however, another R package that also creates MARS models, albeit in a different format. The maintainer of the earth package couldn't resist the temptation not to call the function that converts from one model format to the other mars.to.earth. Nice.)

The benefit that MARS models bring us is the ability to incorporate 'kinks' in the model and to let the data determine how many such kinks to incorporate and where to place them.

Running earth on the bookie probability and margin data gives the following model:

Predicted Margin = 20.7799 + if(Prob > 0.6898155, 162.37738 x (Prob - 0.6898155),0) + if(Prob < 0.6898155, -91.86478 x (0.6898155 - Prob),0)

This is a model with one kink at a probability of around 69%, and it does a slightly better job at explaining the variability in game margins: it gives us an R-squared of 22.7%.

When you overlay it on the actual data, it looks like this.

2010 - Bookie Probability vs Score Difference - MARS.png

You can see the model's distinctive kink in the diagram, by virtue of which it seems to do a better job of dissecting the data for games with higher probabilities.

It's hard to keep all of these models based on bookie probability in our head, so let's bring them together by charting their predictions for a range of bookie probabilities.

2010 - Bookie Probability vs Score Difference - Predictions.png

For probabilities between about 30% and 70%, which approximately equates to prices in the $1.35 to $3.15 range, all four models give roughly the same margin prediction for a given bookie probability. They differ, however, outside that range of probabilities, by up to 10-15 points. Since only about 37% of games have bookie probabilities in this range, none of the models is penalised too heavily for producing errant margin forecasts for these probability values.

So far then, the best model we've produced has used only bookie probability and a MARS modelling approach.

Let's finish by adding the other MARS back into the equation - my MARS Ratings, which bear no resemblance to the MARS algorithm, and just happen to share a name. A bit like John Howard and John Howard.

This gives us the following model:

Predicted Margin = 14.487934 + if(Prob > 0.6898155, 78.090701 x (Prob - 0.6898155),0) + if(Prob < 0.6898155, -75.579198 x (0.6898155 - Prob),0) + if(MARS_Diff < -7.29, 0, 0.399591 x (MARS_Diff + 7.29)

The model described by this equation is kinked with respect to bookie probability in much the same way as the previous model. There's a single kink located at the same probability, though the slope to the left and right of the kink is smaller in this latest model.

There's also a kink for the MARS Rating variable (which I've called MARS_Diff here), but it's a kink of a different kind. For MARS Ratings differences below -7.29 Ratings points - that is, where the home team is rated 7.29 Ratings points or more below the away team - the contribution of the Ratings difference to the predicted margin is 0. Then, for every 1 Rating point increase in the difference above -7.29, the predicted margin goes up by about 0.4 points.

This final model, which I think can still legitimately be called a simple one, has an R-squared of 23.5%. That's a further increase of 0.8%, which can loosely be thought of as the contribution of MARS Ratings to the explanation of game margins over and above that which can be explained by the bookie's probability assessment of the home team's chances.

A Proposition Bet on the Game Margin

We've not had a proposition bet for a while, so here's the bet and a spiel to go with it:

"If the margin at quarter time is a multiple of 6 points I'll pay you $5; if it's not, you pay me a $1. If the two teams are level at quarter-time it's a wash and neither of us pay the other anything.

Now quarter-time margins are unpredictable, so the probability of the margin being a multiple of 6 is 1-in-6, so my offering you odds of 5/1 makes it a fair bet, right? Actually, since goals are worth six points, you've probably got the better of the deal, since you'll collect if both teams kick the same number of behinds in the quarter.

Deal?"

At first glance this bet might look reasonable, but it isn't. I'll take you through the mechanics of why, and suggest a few even more lucrative variations.

Firstly, taking out the drawn quarter scenario is important. Since zero is divisible by 6 - actually, it's divisible by everything but itself - this result would otherwise be a loser for the bet proposer. Historically, about 2.4% of games have been locked up at the end of the 1st quarter, so you want those games off the table.

You could take the high moral ground on removing the zero case too, because your probability argument implicitly assumes that you're ignoring zeroes. If you're claiming that the chances of a randomly selected number being divisible by 6 is 1-in-6 then it's as if you're saying something like the following:

"Consider all the possible margins of 12 goals or less at quarter time. Now twelve of those margins - 6, 12, 18, 24, 30, 36, 42, 48, 54, 60, 66 and 72 - are divisible by 6, and the other 60, excluding 0, are not. So the chances of the margin being divisible by 6 are 12-in-72 or 1-in-6."

In running that line, though, I'm making two more implicit assumptions, one fairly obvious and the other more subtle.

The obvious assumption I'm making is that every margin is equally likely. Demonstrably, it's not. Smaller margins are almost universally more frequent than larger margins. Because of this, the proportion of games with margins of 1 to 5 points is more than 5 times larger than the proportion of games with margins of exactly 6 points, the proportion of games with margins of 7 to 11 points is more than 5 times larger than the proportion of games with margins of exactly 12 points, and so on. It's this factor that, primarily, makes the bet profitable.

The tendency for higher margins to be less frequent is strong, but it's not inviolate. For example, historically more games have had a 5-point margin at quarter time than a 4-point margin, and more have had an 11-point margin than a 10-point margin. Nonetheless, overall, the declining tendency has been strong enough for the proposition bet to be profitable as I've described it.

Here is a chart of the frequency distribution of margins at the end of the 1st quarter.

The far-less obvious assumption in my earlier explanation of the fairness of the bet is that the bet proposer will have exactly five-sixths of the margins in his or her favour; he or she will almost certainly have more than this, albeit only slightly more.

This is because there'll be a highest margin and that highest margin is more likely not to be divisible by 6 than it is to be divisible by 6. The simple reason for this is, as we've already noted, that only one-sixth of all numbers are divisible by six.

So if, for example, the highest margin witnessed at quarter-time is 71 points (which, actually, it is), then the bet proposer has 60 margins in his or her favour and the bet acceptor has only 11. That's 5 more margins in the proposer's favour than the 5/1 odds require, even if every margin was equally likely.

The only way for the ratio of margins in favour of the proposer to those in favour of the acceptor to be exactly 5-to-1 would be for the highest margin to be an exact multiple of 6. In all other cases, the bet proposer has an additional edge (though to be fair it's a very, very small one - about 0.02%).

So why did I choose to settle the bet at the end of the 1st quarter and not instead, say, at the end of the game?

Well, as a game progresses the average margin tends to increase and that reduces the steepness of the decline in frequency with increasing margin size.

Here's the frequency distribution of margins as at game's end.

(As well as the shallower decline in frequencies, note how much less prominent the 1-point game is in this chart compared to the previous one. Games that are 1-point affairs are good for the bet proposer.)

The slower rate of decline when using 4th-quarter rather than 1st-quarter margins makes the wager more susceptible to transient stochastic fluctuations - or what most normal people would call 'bad luck' - so much so that the wager would have been unprofitable in just over 30% of the 114 seasons from 1897 to 2010, including a horror run of 8 losing seasons in 13 starting in 1956 and ending in 1968.

Across all 114 seasons taken as a whole though it would also have been profitable. If you take my proposition bet as originally stated and assume that you'd found a well-funded, if a little slow and by now aged, footballing friend who'd taken this bet since the first game in the first round of 1897, you'd have made about 12c per game from him or her on average. You'd have paid out the $5 about 14.7% of the time and collected the $1 the other 85.3% of the time.

Alternatively, if you'd made the same wager but on the basis of the final margin, and not the margin at quarter-time, then you'd have made only 7.7c per game, having paid out 15.4% of the time and collected the other 84.6% of the time.

One way that you could increase your rate of return, whether you choose the 1st- or 4th-quarter margin as the basis for determining the winner, would be to choose a divisor higher than 6. So, for example, you could offer to pay $9 if the margin at quarter-time was divisible by 10 and collect $1 if it wasn't. By choosing a higher divisor you virtually ensure that there'll be sufficient decline in the frequencies that your wager will be profitable.

In this last table I've provided the empirical data for the profitability of every divisor between 2 and 20. For a divisor of N the bet is that you'll pay $N-1 if the margin is divisible by N and you'll receive $1 if it isn't. The left column shows the profit if you'd settled the bet at quarter-time, and the right column if you'd settled it all full-time.

As the divisor gets larger, the proposer benefits from the near-certainty that the frequency of an exactly-divisible margin will be smaller than what's required for profitability; he or she also benefits more from the "extra margins" effect since there are likely to be more of them and, for the situation where the bet is being settled at quarter-time, these extra margins are more likely to include a significant number of games.

Consider, for example, the bet for a divisor of 20. For that wager, even if the proportion of games ending the quarter with margins of 20, 40 or 60 points is about one-twentieth the total proportion ending with a margin of 60 points or less, the bet proposer has all the margins from 61 to 71 points in his or her favour. That, as it turns out, is about another 11 games, or almost 0.1%. Every little bit helps.

Grand Finals: Points Scoring and Margins

How would you characterise the Grand Finals that you've witnessed? As low-scoring, closely fought games; as high-scoring games with regular blow-out finishes; or as something else?

First let's look at the total points scored in Grand Finals relative to the average points scored per game in the season that immediately preceded them.

GF_PPG.png

Apart from a period spanning about the first 25 years of the competition, during which Grand Finals tended to be lower-scoring affairs than the matches that took place leading up to them, Grand Finals have been about as likely to produce more points than the season average as to produce fewer points.

One way to demonstrate this is to group and summarise the Grand Finals and non-Grand Finals by the decade in which they occurred.

GF_PPG_CHT.png

There's no real justification then, it seems, in characterising them as dour affairs.

That said, there have been a number of Grand Finals that failed to produce more than 150 points between the two sides - 49 overall, but only 3 of the last 30. The most recent of these was the 2005 Grand Final in which Sydney's 8.10 (58) was just good enough to trump the Eagles' 7.12 (54). Low-scoring, sure, but the sort of game for which the cliche "modern-day classic" was coined.

To find the lowest-scoring Grand Final of all time you'd need to wander back to 1927 when Collingwood 2.13 (25) out-yawned Richmond 1.7 (13). Collingwood, with efficiency in mind, got all of its goal-scoring out of the way by the main break, kicking 2.6 (20) in the first half. Richmond, instead, left something in the tank, going into the main break at 0.4 (4) before unleashing a devastating but ultimately unsuccessful 1.3 (9) scoring flurry in the second half.

That's 23 scoring shots combined, only 3 of them goals, comprising 12 scoring shots in the first half and 11 in the second. You could see that many in an under 10s soccer game most weekends.

Forty-five years later, in 1972, Carlton and Richmond produced the highest-scoring Grand Final so far. In that game, Carlton 28.9 (177) held off a fast-finishing Richmond 22.18 (150), with Richmond kicking 7.3 (45) to Carlton's 3.0 (18) in the final term.

Just a few weeks earlier these same teams had played out an 8.13 (63) to 8.13 (63) draw in their Semi Final. In the replay Richmond prevailed 15.20 (110) to Carlton's 9.15 (69) meaning that, combined, the two Semi Finals they played generated 22 points fewer than did the Grand Final.

From total points we turn to victory margins.

Here too, again save for a period spanning about the first 35 years of the competition during which GFs tended to be closer fought than the average games that had gone before them, Grand Finals have been about as likely to be won by a margin smaller than the season average as to be won by a greater margin.

GF_MPG.png

Of the 10 most recent Grand Finals, 5 have produced margins smaller than the season average and 5 have produced greater margins.

Perhaps a better view of the history of Grand Final margins is produced by looking at the actual margins rather than the margins relative to the season average. This next table looks at the actual margins of victory in Grand Finals summarised by decade.

GF_MOV.png

One feature of this table is the scarcity of close finishes in Grand Finals of the 1980s, 1990s and 2000s. Only 4 of these Grand Finals have produced a victory margin of less than 3 goals. In fact, 19 of the 29 Grand Finals have been won by 5 goals or more.

An interesting way to put this period of generally one-sided Grand Finals into historical perspective is provided by this, the final graphic for today.

GF_MOV_PC.png

They just don't make close Grand Finals like they used to.

Marginally Interesting

Here are a handful of facts on AFL margins:

  • The largest ever victory margin was 190 points (Fitzroy over Melbourne in 1979)
  • Every margin between 0 and 150 points has been achieved at least once except margins of 136, 144, 145, 148 and 149 points.
  • Last season, no game finished with a victory margin of 25 points
  • No game finished with a margin of 47 points in the previous 2 seasons
  • No game finished with a margin of 67 points in the previous 5 seasons
  • No game finished with a margin of 90, 94 or 98 points in the previous 8 seasons
  • No game finished with a margin of 109 points in the previous 12 seasons
  • No game finished with a margin of 120 points in the previous 17 seasons
  • No game finished with a margin of 128 points in the previous 39 seasons
  • No game finished with a margin of 161 points in the previous 109 seasons
  • At least one game has finished with a margin of 6 points in each of the previous 48 seasons
  • At least one game has finished with a margin of 26 points in each of the previous 42 seasons