The Comparative Performance of Australian and UK Chasers and Chase Contestants
/The Chase remains a relatively popular gameshow in both Australia and the UK (see here and here) where it is played using identical rules but different currencies.
One particularly interesting feature is the fact that three of the UK Chasers - Anne Hegerty, Mark Labbett, and Shaun Wallace - have also appeared as Chasers in the Australian version, although the latter has appeared in relatively few Australian episodes and all three have been absent of late due to COVID restrictions.
THE DATA
For the Australian data, I’ll be relying on the 9 Dec 2020 version of this Google document from James Spencer, and for the UK data, I’ll be relying on my 9 Dec 2020 scrape of this website.
After removing the Melbourne Cup and Oaks Day episodes from the Australian sample, because these episodes include only two rather than the usual four contestants, we’re left with 793 episodes spanning the period from September 2015 to June 2020.
For the UK, we have 1,624 episodes spanning the period from June 2009 to December 2020.
DATA EXPLORATION
First, let’s look at the raw win percentages of each Chaser in each country.
We see that, Darragh Ennis’ three-episode performance aside, Matt Parkinson has the best winning rate of any Chaser at almost 80% across 163 exclusively Australian episodes.
Next is Anne Hegerty. She’s at almost 79% overall across the UK and Australia, her aggregate dragged down a little by her slightly smaller winning rate in Australia. Third is Jenny Ryan at just over 78%, exclusively in UK episodes.
From this table we can also see that, overall, UK contestants have performed slightly better than Australian contestants, with Chasers in Australia winning almost 77% of the time, compared to 76% of the time in the UK. That said, both Anne and Mark have won more often in their home country UK than they have in Australia, perhaps because of the disadvantage they face on more Aussie-centric questions.
It might be the case, however, that Chasers have faced contestants of different average abilities in Final Chases, a factor that we’ll later attempt to at least partially control for by creating a predictive model.
Looking next at overall Chaser success rates by the size of the Target being chased, we find that:
no target below 11 has ever been enough to secure the prize fund in the UK and no target below 12 has been enough to do the same in Australia
the success rate of Chasers declines as the Target increases, most dramatically once the Target reaches 19 in the UK, and 18 in Australia
the success rate in both the UK and Australia is 50% or less for all targets of 20 or more
no target above 26 has ever been run down by a Chaser in the UK, and none above 24 in Australia
the targets in the UK have ranged from 3 to 28, while in Australia they’ve ranged from 5 to 28
If we group the targets a little, we can get a slightly better idea of the trends. In particular, we can see that Chasers in the UK do somewhat better than Chasers in Australia with targets of 18 or more, which are also targets that they tend to face more often (39% of episodes in the UK versus 34% in Australia).
Overall, we can also see that Chasers in the UK tend to face slightly larger targets, on average - about 0.5 questions higher. In addition to facing larger targets more often, they also face smaller targets less often, with targets of 14 or less occurring in 29% of UK episodes, but 35% of Australian episodes.
So, one source of the overall higher win rates for Chasers in Australia is the fact that they tend, on average to face smaller targets.
By how many contestants in the Final Chase are those targets being set and defended?
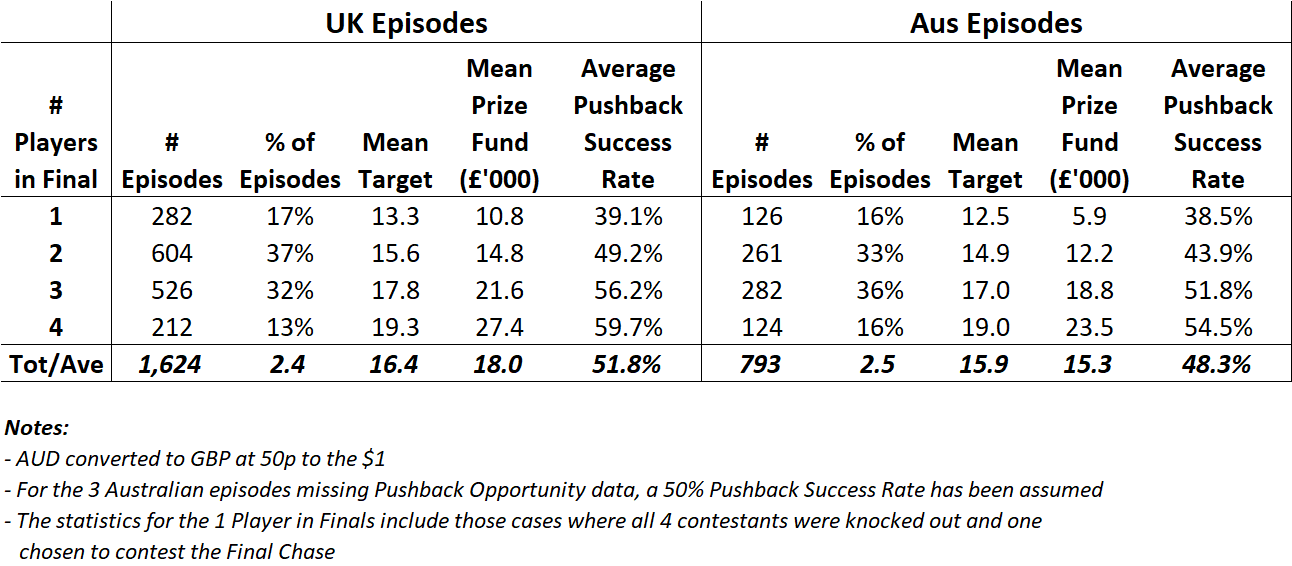
In UK episodes, an average 2.4 contestants play Final Chase, compared to 2.5 contestants in Australia. But, for any given number of Final contestants, the targets set in Australian tend to be lower, by about 0.7 to 0.8 questions if there’s between one and three Final contestants, and by about 0.3 questions if there’s a full deck of four contestants.
In addition to setting lower targets, Final contestant panels in Australia also tend to fare worse on pushbacks, only slightly so in the case of one-person Final panels, but by about 4 to 5% points for larger panels. That’s also advantageous for Australian Chasers.
Finally, before we build a predictive model to estimate Chaser win probabilities, let’s look at individual Chaser statistics based on the number of contestants they faced in the Final Chase.
Firstly, here’s the data for the three dual internationals.
Noting that the sample sizes are small in some cases, we see that:
For all Chasers, the win rate declines and the average final target increases in a fairly similar manner with an increase in the number of players in the Final.
The average number of pushbacks offered also tends to increase as the number of players in the Final increases and therefore as the target tends to increase
As a proportion of the mean target, however, the number of pushbacks offered is fairly constant for each Chaser, though there is some evidence of a slight increase in the rate with increasing target size
Secondly, and finally, here’s the data for the UK-only and Australia-only Chasers.
We find broadly similar patterns, with the exception that there is virtually no sign of any increase in the rate of pushbacks being offered as the mean target increases.
One interesting fact to note is that, while every Chaser (Darragh aside) has been defeated in the UK by a solo Final player, Shaun Wallace, Matt Parkinson and Brydon Coverdale have yet to suffer that fate in Australia.
BUILDING A PREDICTIVE MODEL
For today’s blog I’m going to build another binary logit model that will estimate the probability that a Chaser will run down a target. As potential explanatory variables, we’ll include:
The Chaser name
Whether the episode is from the UK or Australian data
The number of players in the Final Chase
The target set
The size of the Final prize Fund (in GBP)
The broad functional form of the model will be
ln(P(Chaser wins) /(1-P(Chaser wins)) = Constant + Coefficient 1 x Explanatory Variable 1 + Coefficient 2 x Explanatory Variable 2 + …
We’ll firstly fit models with righthand sides described by each of the following, and choose the best based on minimising AIC (the actual AICs are shown in brackets)
Target (AIC = 2,038.4)
Chaser + Target (AIC = 2,021.5)
Chaser + Target + Players in Final (AIC = 2,014.6)
Chaser + Target + Players in Final + Prize Fund (AIC = 2,019.0)
Model 3 is clearly the best of these, so we’ll use it to explore possible interactions, and next fit
3a. Chaser x Source + Target + Players in Final (AIC = 2,013.9)
3b. Chaser x Source + Target + Players in Final x Source (AIC = 2,014.3)
3c. Chaser + Target + Players in Final x Source (AIC = 2,011.4)
3d. Chaser x Source + Target x Source + Players in Final x Source (AIC = 2,015.5)
Here, Model 3c is clearly superior, and also has an AIC less than that for Model 3, so we’ll settle on Model 3c as our final model.
The fitted version of this model appears at right.
One implication of this model is that, unlike what we found in this earlier blog where each Chaser’s probabilities responded uniquely to changes in the size of the target and the prize fund, the probability that a Chaser runs down a target here is found to be best described by some fixed measure of his or her ability, adjusted by some fixed amounts based on the size of the target, the number of players in the Final chase, and whether they are facing UK or Australian contestants.
In retrospect, I think the model we’ve found here does a better job of explaining a Chaser’s probability of victory than the one from the previous blog. In that blog, I failed to consider the size of the team for the Final Chase, and hence the differential rate at which pushback opportunities might be converted to pushbacks.
A worked example might help explain how this new model can be used, and how the coefficients should be interpreted.
Consider the scenario where three of us are facing Brydon having set a target of 19.
The input we need for the logistic then is:
8.08 (the intercept) + 1.26 (because it’s Brydon as Chaser) - 0.415 x 19 (the target) - 0.323 x 3 (the number of us in the Final), which is 0.49 (note that we’re assuming the episode is in Australia, which is the only place for which we have data for Brydon).
So, our estimate of Brydon’s chances of running us down in this case is 1/(1+exp(-0.49)), which is about 62%.
If we’d set a target of 20, instead, the input would change by -0.415 to 0.074, and the estimated probability for Brydon would drop to 52%. Defending that target with a panel of four finalists instead of three would change the input by another 0.323, dropping it to -0.249, and slipping the estimated probability for Brydon to 44%
Note that Shaun Wallace is the reference Chaser in this model, which means that he implicitly has a zero coefficient for the Chaser input.
If we assume a final target of 16 and that we have 2.5 players in the Final, we can come up with an ordering of the Chasers (minimum 20 episodes), from most to least likely, in terms of probability of running down that target:
Anne Hegerty in the UK
Mark Labbett in the UK
Paul Sinha in the UK
Matt Parkinson in Australia
Brydon Coverdale in Australia
Jenny Ryan in the UK
Anne Hegerty in Australia
Issa Schultz in Australia
Mark Labbett in Australia
Shaun Wallace in the UK
QUALITY OF THE FIT
One way of assessing the quality of the model fit is to compare the model’s fitted probability estimates with actual outcomes.
In this first table we look at the relationship between the initial target and a Chaser’s success rate in running down that target.
We see that all Chasers are, in reality, less likely to chase down larger targets than small ones, and that the fitted model reflects this.
We also see that Anne when in the UK, and Matt in Australia, are best at chasing down larger targets, both in actuality and when we use the model.
The model generally slightly understates the Australian Chasers’ abilities to run down larger targets, most notably for Issa Schultz where it underestimates his actual record by almost 6% points, albeit on a fairly small sample of just 46 episodes.
For the UK Chasers, there’s maybe some slight evidence that it understates the probability that they’ll run down small targets.
By far the largest meaningful discrepancy is for the estimate of Shaun Wallace’s ability to run down larger targets. The model has him at an expected 32% win rate for targets of 19 or more, but his actual rate is almost 10% points higher on a sample of 82 games.
Overall, though, the model seems to provide an acceptable fit when assessed on this dimension.
In this second and last table for this section, we look at the relationship between the number of contestants in the Final Chase and a Chaser’s success rate.
Here we see that, as we saw in the first analysis, lower win rates are associated with more players in the Final Chase. This is partly because more players in the Final are associated with higher average targets, but also partly because more players in the Final are associated with higher average pushback rates (see earlier tables).
Amongst those fitted estimates for which the corresponding actual sample size is 50 or greater, the largest discrepancies are only around 5-6% points (Brydon facing Final panels of 2 or 3 contestants), which is very acceptable
Overall, again, the model seems to provide an acceptable fit when assessed on this dimension.
I’d feel comfortable using it to set a price for a Chaser in a given episode.
SUMMARY AND CONCLUSION
As was true for the model in the previous blog, the model we’ve built here won’t entirely have controlled for the different contestant abilities that each Chaser has faced, and so won’t provide us with perfect estimates of their underlying relative abilities, but it does provide some interesting insights into how their win rates have, on average and with some noise, responded to the size of the targets they’ve faced and the number of contestants they’ve come up against in the Final Chase.
One thing I do wonder is if the Australian data contains a significantly larger proportion of episodes where the contestants have likely been chosen less for their general knowledge than for some other characteristic, such as their occupation or appearance on a reality TV show.
Anyway, I’ll finish by providing a couple of tables that summarise the fitted probabilities for each Chaser under a variety of plausible scenarios.
(Note that these two charts, like all of the charts in this blog, can be clicked on to access a larger version)

As always, comments are welcome.
