MAFL 2011 : Team Dashboard for Round 24

The final MAFL Team Dashboard for season 2011 follows.

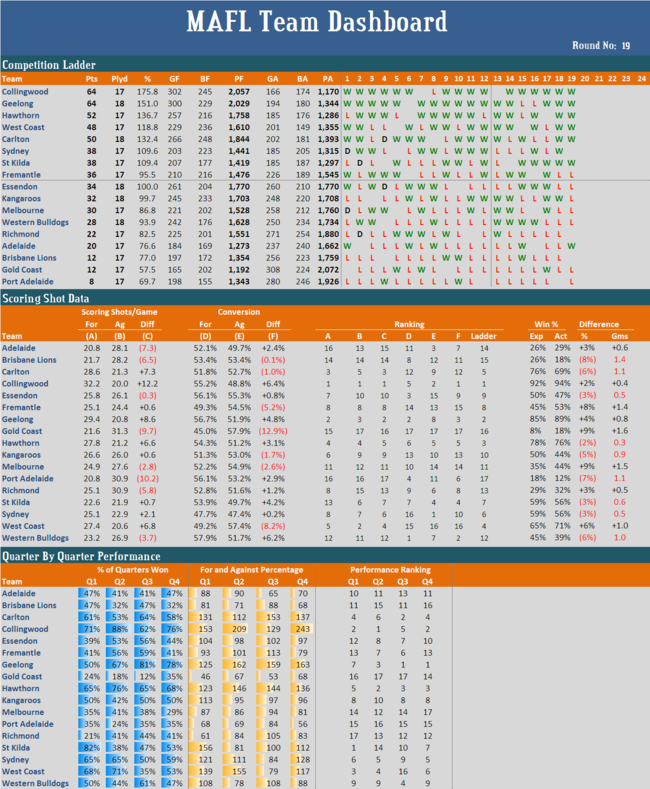
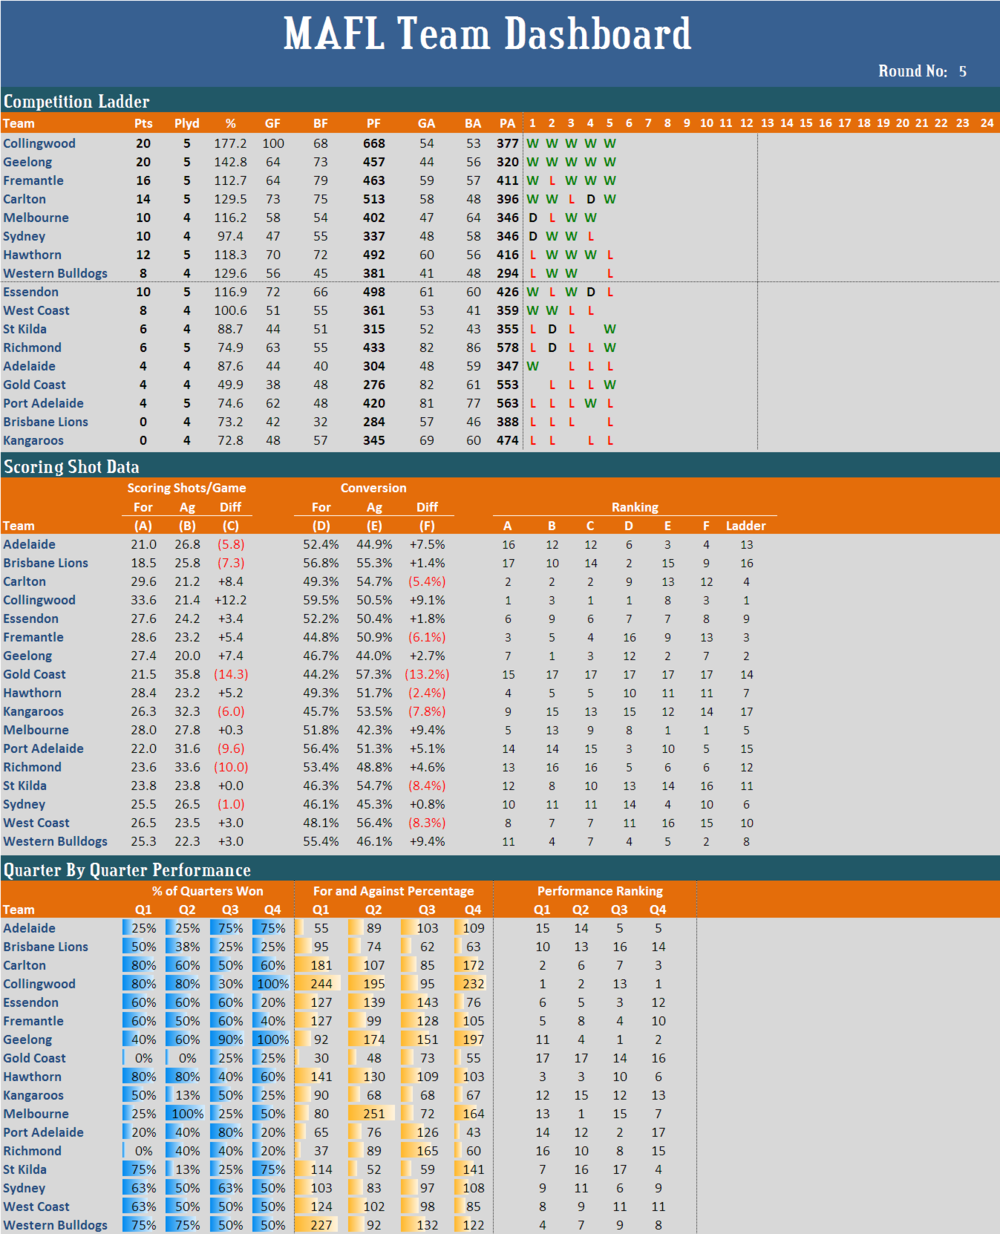
Here are a few final observations: 

  • The Roos, despite not making the Finals, have nonetheless finished the home-and-away season with a percentage above 100.
  • St Kilda and Sydney kicked only 275 and 267 goals respectively across their 22 matches, fewer than, for example, Melbourne, which finished 13th
  • Essendon conceded 326 in its 22 games, more goals than the 15th-placed Lions conceded
  • Port Adelaide kicked an amazingly low 188 behinds all season, 36 fewer than any other team
  • Adelaide, though finishing 14th on the ladder, were 5th best on Opponent Conversion Rate. They were also 9th in 1st terms and 8th in final terms
  • Brisbane, 15th on the ladder, finished 7th on Own Conversion Rate. They also won 2.5 games fewer than their scoring statistics suggest they should have. As well, they finished 11th on 1st terms and 10th on 3rd terms
  • Carlton ran 5th on the ladder but 14th on Own Conversion Rate. So good were their scoring statistics generally, they won 2 games fewer than the Win Production Function predicts
  • Collingwood finished as minor premiers but were 5th on Own Conversion Rate
  • Essendon came 8th but ranked 14th on Opponent Conversion Rate and 12th on 1st terms
  • Fremantle were 11th on the ladder but 15th on Own Conversion Rate. They won over 2 games more than their scoring statistics suggest they should have. They also finished 6th on 3rd term performances
  • Geelong finished 2nd but were 11th on Opponent Conversion Rate and 8th on 1st terms
  • Melbourne ranked 13th on the ladder but last on final terms
  • Port Adelaide finished second-last but were, astonishingly, second on Own Conversion Rate
  • Richmond came 12th but were 8th on Own Scoring Shots per Game and 16th on 1st terms
  • St Kilda wound up 6th but were 13th on Own Scoring Shots per Game and 2nd on Opponent Conversion Rate. They were also 1st on 1st terms, 10th on 2nd terms, and 12th on 3rd terms
  • Sydney were 7th on the ladder but 16th on Own Conversion Rate and 1st on Opponent Conversion Rate
  • West Coast finished 4th despite the twin handicaps of finishing 13th on Own Conversion Rate and 16th on Opponent Conversion Rate. They also finished 14th on 3rd terms
  • The Western Bulldogs came 10th but were 1st on Own Conversion Rate and 5th on 3rd term performances

 Finally, I'd note that: 

  • Collingwood won 82% of 2nd terms and more than doubled its opponents' scores in 2nd and final terms
  • The Gold Coast won less than 20% of its 1st, 2nd an 3rd terms. Only mercy, perhaps, allowed it to win 27% of final terms
  • Port Adelaide won only 18% of 2nd terms
  • Richmond won only 20% of 1st terms
  • St Kilda won 77% of 1st terms and recorded a percentage of 150, then won only 41% of 2nd and of 3rd terms, and 55% of final terms, recording a percentage of just 85 in 2nd terms in doing so
  • Sydney recorded a percentage of just 84 in 3rd terms
  • West Coast recorded a percentage of just 87 in 3rd terms


MAFL 2011 : Team Dashboard for Round 23

Ranking the teams on the basis of what the Win Production Function suggests their winning rate should be given their scoring shot performance across the season, only one change would be made to the composition of the current top 8 on the ladder:  the Dons would drop to ninth and the Roos would grab 8th.

Further, within the top 8 there'd be only one change of order with the Blues taking 4th at the expense of West Coast; the five remaining teams would be ordered exactly as per their position on the competition ladder.

Further down the ladder the shuffling would be only a little more vigorous. Apart from Melbourne, who'd drop from 12th to 15th on the strength of their scoring shot performance, and the Dogs, who'd climb from 13th to 10th, no team would change position by more than one spot.

So, on the basis of just two pieces of data about each team, scoring shot differential and conversion differential, we could replicate the current competition ladder ordering to within one spot for every team bar two of them, neither of them in finals contention. Seems the Win Production Function does a good job of distilling the key aspects of team performance for season 2011, as it has done for many seasons in the past.

Anyway, here's the latest Team Dashboard.

MAFL 2011 : Team Dashboard for Round 22

In a post for the Statistical Analysis journal in 2009 I investigated whether it was better for a team to lead or to trail narrowly at the end of a quarter. This analysis was motivated by a journal article investigating the phenomenon for NCAA basketball, which found that teams in this competition that trailed narrowly at half-time went on to win at a rate statistically significantly greater than 50%. I found only scant evidence for this in VFL/AFL football.
Read More

MAFL 2011 : Team Dashboard for Round 20

From this week's MAFL Team Dashboard I note that there are two teams sitting below Fremantle that have a superior percentage - the Roos and the Dogs. Further evidence for the fortuity of the Dockers' position resides in the fact that, based on their relative scoring shot production and relative conversion rate for those scoring shots, Fremantle have won almost 1.5 games more than they "should" have.

Other teams whose scoring performance is most misaligned, according to the Win Production Function, with their winning rate are: 

  • Melbourne, who've won just under 2 games more than their scoring statistics would predict
  • The Suns (also about 2 games more)
  • Adelaide and West Coast (about a game more)
  • Brisbane (almost 2 games less)
  • Carlton and the Roos (each over a game less)
  • Sydney and the Dogs (each about a game less) 


MAFL 2011 : Team Dashboard for Round 19

The latest (clickable as always) MAFL Team Dashboard follows.

This week I calculated the rank correlations between teams' ladder positions and their ranking on some of the metrics in the Scoring Shot and Performance by Quarter sections. Here are the results: 

  • Rank correlation between ladder position and Scoring Shots For: +0.86
  • Rank correlation between ladder position and Scoring Shots Against: +0.97
  • Rank correlation between ladder position and Scoring Shots Difference: +0.98
  • Rank correlation between ladder position and Own Conversion Rate: -0.09
  • Rank correlation between ladder position and Opponents' Conversion Rate: +0.20
  • Rank correlation between ladder position and Conversion Rate Difference: +0.12
  • Rank correlation between ladder position and ranking on Q1 performances: +0.74
  • Rank correlation between ladder position and ranking on Q2 performances: +0.89
  • Rank correlation between ladder position and ranking on Q3 performances: +0.57
  • Rank correlation between ladder position and ranking on Q4 performances: +0.85

What I make from all of this is that, so far this year, the better-performed teams have differentiated themselves by forcing their opponents to have more difficult scoring shots (and hence poorer conversion rates) and by being especially effective in 2nd and 4th quarters. It's interesting to note that seven of the teams currently sitting in finals positions on the ladder are amongst the top 8 teams ranked on 4th quarter performances. 


MAFL 2011 : Team Dashboard for Round 17

It's been a while since we looked in any detail on a team-by-team basis at the MAFL Team Dashboard, so let's chronicle the best and worst statistics for each team. 

  • Adelaide
    • best statistic: opponents only convert at 49.2% when playing them, the 3rd-lowest opponent conversion rate of any team.
    • worst statistic: there are a few candidates, but the standout is probably their scoring shot production, which stands at 20.9 per game, better only than Port Adelaide's.
  • Brisbane Lions
    • best statistic: their own conversion rate is 53.6%, ranking them 8th on this metric. They're also the 8th-best performers in 1st terms.
    • worst statistic: 16th on the ladder. Hard to do much worse than that.
  • Carlton
    • best statistic: they're 2nd on scoring shot production with 28.5 per game and 2nd on the difference between their and their opponents' scoring shot production.
    • worst statistic: they convert those scoring shots at only 50.7%, 13th-highest in the League
  • Collingwood
    • best statistic: they're 1st on a slew of metrics, not least of them the one that matters most, their ladder position. 
    • worst statistic: though it's improved considerably over the course of the season, their performance in 3rd terms is still only 7th-best.
  • Essendon
    • best statistic: they're 2nd-best performers in 3rd terms and they've the 3rd-best conversion rate of any team at 55.4%.
    • worst statistic: they tend to be slow starters and have only the 14th-best 1st quarter performances.
  • Fremantle
    • best statistic: they're 3rd on performances in the 3rd term.
    • worst statistic: they've a nasty tendency to drop off in the final term, which has led to them racking up the League's 2nd-worst set of 4th quarter statistics.
  • Geelong
    • best statistic: they've the best 3rd term and the best 4th term performance of any team having won 78% and 81% of these terms respectively.
    • worst statistic: they're slow starters, with their 44% record in 1st terms ranking them 10th on this metric.
  • Gold Coast
    • best statistic: 'best' is not really an appropriate description for any of their statistics. Their 'least worst' is probably their ladder position of 15th though they're also 15th on scoring shot production, churning out one about every four minutes of play.
    • worst statistic:  take your pick.
  • Hawthorn
    • best statistic: they're the 2nd-best team in 2nd terms having won 73% of them.
    • worst statistic: they're only the 7th-best team in 1st terms, though even there they have a 60% record.
  • Kangaroos
    • best statistic: they rank 6th on scoring shot production with 26.5 per game.
    • worst statistic: they rank 13th on opponent scoring shot conversion which, at 53.7% and coupled with a paltry 51.7% own conversion rate, sees them ranked 14th on the difference between own and opponent conversion rates.
  • Melbourne
    • best statistic: they're 6th on opponent conversion rate at just 51.5%.
    • worst statistic: they're 3rd-last in 4th terms having won just 33% of them.
  • Port Adelaide
    • best statistic: comfortably best is their own conversion rate, which is 2nd in the League at 56.8%.
    • worst statistic: though they've converted well they've had far too few scoring shots to convert. They're worst in the League on this metric at just 20.6 per game.
  • Richmond
    • best statistic: they rank 5th on opponents' conversion rate, which stands at just 51.1%.
    • worst statistic: they are the poorest starters in the competition having won only 22% of their 1st terms.
  • St Kilda
    • best statistic: no team starts better than they do. They've won 80% of their 1st quarters and recorded a 145 percentage in doing so.
    • worst statistic: they back-end those sterling 1st terms with appalling 2nd terms, winning only 30% of them, which ranks them 14th on this metric.
  • Sydney
    • best statistic: they've allowed their opponents to convert at only 47%, the lowest opponent conversion rate in the competition.
    • worst statistic: they've converted almost as poorly as their opponents. At just 47.7%, they're the 2nd-worst in the League on this metric.
  • West Coast
    • best statistic: they've the 2nd-lowest metric for opponent scoring shot production at just 20.7 per game.
    • worst statistic: bizarrely for a team lying 4th on the ladder, they've the 4th-worst own conversion rate (50%), the 3rd-worst opponent conversion rate (56.9%), and the 2nd-worst set of performances in 3rd terms (they've won only 1 in 3).
  • Western Bulldogs
    • best statistic: they've the highest conversion rate in the competition at 57.1%.
    • worst statistic: they're 12th in terms of own and opponent scoring shot production, and 12th on the ladder.

Here's the entire Dashboard:


MAFL 2011 : Team Dashboard for Round 16

With the Cats and the Roos both losing yet again this week, the uncanny accuracy of the Win Production function has improved so that only five teams remain that have won or lost more than 1 game more than their scoring statistics would suggest.

Fremantle has won 1.5 games more than their scoring statistics would portend, Geelong 1.4 games more, and the Gold Coast 1.1 games more, while the Lions have lost 1.1 games more and the Dons 1.5 games more. Every other team is within 1 win of what you'd predict using the Win Production function we discussed here.

MAFL 2011 : Team Dashboard for Round 15

Though the official competition ladder will say otherwise, Collingwood now heads Geelong on the MAFL Team Dashboard by virtue of the fact that the Pies' 48 points from a possible 52 represents a higher percentage than the Cats' 52 from a possible 56.

Essendon's victory over the Cats served to reduce the gap between each team's actual winning percentage and that which might be expected based on their season-long scoring statistics. Nonetheless, Essendon are still about a win-and-a-half below what might be expected, and the Cats are about 2 wins above.

Other teams that have recorded winning percentages significantly above or below what their scoring statistics would suggest are the Lions (1 win fewer than expected), Fremantle (1.5 wins more), Gold Coast (1 win more), the Roos (1.5 wins fewer), and Richmond (almost 1 win more). Every other team is within about half a win of what their scoring statistics would suggest is to be expected.


MAFL 2011 : Team Dashboard for Round 13

Here's the latest MAFL Team Dashboard.

Broadly, the differences between teams' actual winning percentages and those we'd predict using the Win Prediction Function we calculated in this blog, have been shrinking. Significant discrepancies now remain only for Essendon, which has a winning rate 19% below what you'd expect (or about 2 games), the Roos (10% below), and the Lions (9% below), and, on the positive side, for Geelong (20% above), Gold Coast (12% above), Fremantle (10% above), and Sydney (8% above).

Every other team is within 1 win of what you'd expect given their scoring statistics.


MAFL 2011 : Team Dashboard for Round 12

Here's the Team Dashboard for Round 12.

This week I'll draw your attention to the Scoring Shot Data section, in particular the rightmost columns where I've calculated each team's actual and expected winning percentage (using the win production function from here). There you can see that, based on the relevant teams' relative scoring shot production and conversion rates:

  • Four teams have won about 1 or more games fewer than would have been expected given their respective scoring statistics: Essendon (about 2 games fewer), Kangaroos (about 1.5 games), Brisbane (about 0.9 games), and the Dogs (about 0.8 games)
  • Another four teams have won about 1 or more games more than would have been expected given their respective scoring statistics: Geelong (about 2 games more), Gold Coast (about 1.5 games), Sydney (about 1.1 games), and Fremantle (about 0.7 games)


MAFL 2011 : Team Dashboard for Round 8

Relative to each team's respective ladder position, here's where its dashboard metrics are anomalous: 

  • Adelaide: 12th on the ladder but 5th on Own Conversion rate and 1st on Opponent Conversion rate (the problem is that its 16th on Own Scoring shots and 13th on Opponent Scoring shots). Also, 5th on final term performances.
  • Brisbane Lions: 17th on the ladder but 7th on Own Conversion rate (but alas 15th on Own Scoring shot production. Also, 10th on 1st-quarter performances (though still with a sub-100 percentage for the term).
  • Carlton: 3rd on the ladder but 13th on Own Conversion rate and 14th on Opponent Conversion rate (offset by being 2nd on Own Scoring shot production and 3rd on Opponent Scoring shot production). Variously 6th to 10th on quarter-by-quarter performances, with a particularly poor record in 3rd terms.
  • Collingwood: 2nd on the ladder but 16th on 3rd term performances, with a sub-100 percentage for that term. However, its percentages for 2nd and 4th terms are both over 200.
  • Essendon: 5th on the ladder but 11th on final terms, though still with a near 100 percentage for that term (and with a 220 percentage for 3rd terms).
  • Fremantle: 8th on the ladder but 16th on both Own and Opponent Conversion. Also, 14th in final terms. 
  • Geelong: 1st on the ladder but 14th on Own Conversion and only 6th on Own Scoring Shot production. Also, 8th on 1st terms.
  • Gold Coast: 14th on the ladder but no better than 15th in any single term and with percentages in every term 62 or lower.
  • Hawthorn: 4th on the ladder but 9th on Own Conversion rate and 11th on Opponent Conversion rate. Also, 9th on 1st term performances.
  • Kangaroos: 13th on the ladder but 7th on Own Scoring shot production.
  • Melbourne: 9th on the ladder but 3rd on 2nd term performances and 15th on 3rd term performances.
  • Port Adelaide: 16th on the ladder but 6th on Own Conversion (wasted by being 17th on Own Scoring Shot production). Also, 7th on performances in the 3rd term.
  • Richmond: 10th on the ladder but 16th on Opponent Scoring Shot production, ameliorated to some extent by being 3rd on Opponent Conversion. Also, 17th on 1st term performances and still yet to win a 1st term in any game.
  • St Kilda: 15th on the ladder but 8th on Opponent Conversion . Also, 3rd on performances in the 1st term, 7th in final term performances, and 17th on 2nd term performances and yet to win a 2nd term in any game, having been outscored by more than 2-to-1 in 2nd terms so far.
  • Sydney: Fairly unremarkable in all respects, save perhaps for slightly sub-par performances in the final term.
  • West Coast: 7th on the ladder but 12th on both Own and Opponent Conversion, offset in particular by being 5th on Opponent Scoring Shot production. Also, 2nd on 1st term performances and 14th on 3rd term performances.
  • Western Bulldogs: 11th on the ladder but 4th on Own Conversion. Also, 1st on 1st term performances (with a 225 percentage) and 5th on 3rd term performances.


MAFL 2011 : Team Dashboard for Round 7

A handful of comments on the Quarter-By-Quarter Performance section this week: 

  • Three teams are undefeated for one of the quarters in all of their matches: Collingwood and Geelong in final terms, and Melbourne in 2nd terms
  • Richmond have yet to win a 1st term; they've drawn only one in their seven games
  • St Kilda have yet to win a 2nd term; they've drawn only one in their six games
  • The Dogs, despite filling the 11th spot on the ladder (as I construct it), have the best 1st term record in the League
  • Melbourne have the best 2nd term record in the League (but the 15th best for each of the terms on either side)
  • Geelong have the best 3rd term record, and the Pies the best final term record in the League