Seeking Significance
/Distinguishing between a statistical aberration and a meaningful deviation from what's expected is a skill that's decidedly difficult to acquire. If my train to work is late 15 days out of 20 is that a sign that the train is now permanently more likely to be late than to be early?
The TAB offers a 50:50 proposition bet on every AFL game that the match will end with an even or an odd number of points being scored. I can find no reason to favour one of those outcomes over another, so even money odds seems like a reasonable proposition.
How strange it is then that 6 of the last 8 seasons have finished with a preponderance of games producing an even total. Surely this must be compelling evidence of some fundamental change in the sport that's tilting the balance in favour of even-totalled results. Actually, that's probably not the case.
One way to assess the significance of such a run is to realise that we'd have been equally as stunned if the preponderance had been of odd-totalled games and then to ask ourselves the following question: if even-totalled and odd-totalled games were equally likely, over 112 seasons how likely is it that we could find a span of 8 seasons within which there was a preponderance of once type of total over the other in 6 of those seasons?
The answer - which I found by simulating 100,000 sets of 112 seasons - is 99.8%. In other words, it's overwhelmingly likely that a series of 112 seasons should contain somewhere within it at least one such sequence of 6 from 8.
Below is a chart showing the percentage of games finishing with an even total for each if the 112 seasons of the competition. The time period we've just been exploring is that shown in the rightmost red box.
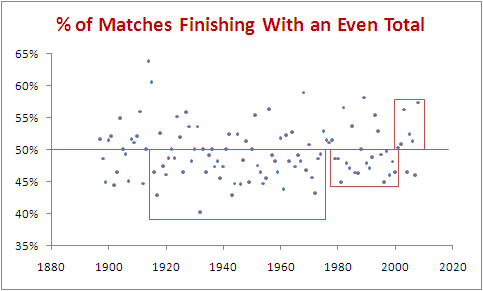
If we go back a little further we can find a period from 1979 to 2000 in which 16 of the 22 seasons finished with a preponderance of seasons with more odd-totalled than even-totalled games. This is the period marked with the middle red box. Surely 16 from 22 is quite rare.
Well, no it isn't. It's rarer than 6 from 8 but, proceeding in a manner similar to how we proceeded earlier we find that there's about a 62% probability of such a run occurring at least once in the span of 112 seasons. So, it's still comfortably more likely than not that we should find such a sequence even if the true probability of an even-totalled game is exactly 50%.
Okay, we've dismissed the significance of 6 from 8 and 16 from 22, but what about the period from 1916 to 1974 (the leftmost red box) during which 37 of the 59 seasons had predominantly odd-totalled games? Granted, it's a little more impressive than either of the shorter sequences, but there's still a 31% chance of finding such a sequence in a 112 season series.
Overall then, despite the appearance of these clusters, it's impossible to reject the hypothesis that the probability of an even-totalled game is and always has been 50%.
Further evidence for this is the fact that the all-time proportion of even-totalled games is 49.6%, a mere 55 games short of parity. Also, the proportion of seasons in which the deviation from 50% is statistically significant at the 1% level is 0.9%, and the proportion of seasons in which the deviation from 50% is statistically significant at the 5% level is 4.5%.
Finding meaningful and apparently significant patterns in what we observe is a skill that's served us well as a species. It's a good thing to recognise the pattern in the fact that 40 of the 42 people who've eaten that 6-day-old yak carcass are no longer part of the tribe.
The challenge is to be aware that this skill can sometimes lead us to marvel at - in some cases even take credit for - patterns that are just statistical variations. If you look out for them you'll see them crop up regularly in the news.
