Score Progression Charts
This page contains charts based on the score progression data from the incomparable www.afltables.com website. That data comprises the timing of every scoring event and quarter-end in every game of AFL football played since 2008. It also records the scorer of every goal and non-rushed behind.
WHAT IS THE ULTIMATE WINNING RATE OF ALL TEAMS THAT ARE FIRST TO SCORE X POINTS?
Topic: This chart was, in its original form, designed to explore and estimate the apparent advantage of being the first team to reach some arbitrary total. After the first version was posted on Twitter, I was asked about the size of the leads held by the teams first reaching some target score - hence the version you see at right where the points have been replaced by a number reflecting the average lead.
Points of Interest:
- Teams that are first to as little as 6 points win over 60% of the time and lead, on average, by about a goal
- Teams that are first to score 25 points win over 70% of the time and lead by about 2 and a half goals, on average, when they achieve that target.
- Teams that are first to score 50 points win over 80% of the time and lead by about 3 and a half goals, on average, when they achieve that target.
This analysis provides an interesting case study of the need to think carefully about causality - it's not that the team that first gets to, say, 25 points, wins because they achieved this target first, it's that the team that first achieves the target is more often the better team Getting to 25 first is a symptom not a cause of their likely victory.
WHO SCORES NEXT WHEN THE LEAD IS X?
Topic: This chart was created to explore the topic of which team tends to register the next scoring event after a home team lead of a given size is attained, dependent on which team scored last and whether they scored a goal or a behind.
Points of Interest
A few things stand out in this chart:
- The larger the home team lead, the more likely the home team is to score next, regardless of the size of the home team lead, which team scored last or whether they scored a goal or a behind
- If the last score was a home team behind, the home team is more likely to score next than if the last score was a home team goal
- If the last score was an away team goal, the away team is less likely to score next than if the last score was an away team behind
The charts below investigate the same phenomenon, but presents the results in the form of proportions. In the chart on the left we have, for a given Home team lead, what proportion of next scoring shots are either Away goals, Away behinds, Home goals or Home behinds.
On the right we have the same data but we ignore the distinction between goals and behinds. This chart gives a clear measure of Home team advantage in that we see, when scores are level, the Home team is slightly more likely to score next.
TIME BETWEEN SUCCESSIVE SCORING EVENTS
Topic: This chart was created to explore the season-to-season variability in the cadence of scoring events, in particular to determine whether or not the profile of time-between-scoring-events differed materially from one season to the next
Points of Interest
The very clear conclusion from this chart is that the profile of time-between-scoring-events looks remarkably similar across the last 9 seasons.
SCORING BURSTS
Topic: This chart looks at the longest, shortest and median periods of time between successive scoring shots. It allows us to answer, for example, the shortest period in which 20 Scoring Shots have been registered, the longest time taken to produce 20 Scoring Shots, and the median time taken. Note that these metrics relate not to the first X Scoring Shots, but to any Scoring Shot gaps of a fixed size.
In our 20 Scoring Shot example then, it could be that the shortest period was between (say) the 15th and 34th Scoring Shots in a particular game.
Points of Interest
Perhaps the most remarkable phenomenon revealed in this chart is the linear nature of the relationship between median time and Scoring Shot Gap. It grows at about 2.5 minutes per Scoring Shot all the way until about a Gap of 40 Scoring Shots. We can think of this as the typical scoring rate in games across the 2008 to 2016 period. This equates to about 48 Scoring Shots per game.
The minimum time also shows a fairly linear relationship between Gaps of about 10 to 50 Scoring Shots - the shortest period between 10 Scoring Shots is about 8 minutes, between 30 Scoring Shots about 42 minutes, and that between 50 Scoring Shots about 78 minutes.
LEADING AND TRAILING SCORE PROFILE ACROSS TIME
Topic: This chart was created to explore the evolution of leading and trailing scores across the entire extent of an AFL contest.
For it, we firstly convert the raw timings in the input data into a "proportion of game" view, by dividing each quarter into 25 equal parts.
After that, we look at the profile of leading and trailing scores at each of those 100 points during a completed game.
Points of Interest
The most obvious observation from this analysis is that the mean leading and trailing score across time is remarkably linear, and that the upper and lower quartiles of these scores are also remarkably well-behaved.
Perhaps the other most interesting observation is that the bulk of leading scores exceed the bulk of trailing scores at the same point in the contest across the entirety of the match (as evidenced by the fact that the interquartile ranges of the leading and trailing boxplots fail to overlap for all but the earliest parts of the game).
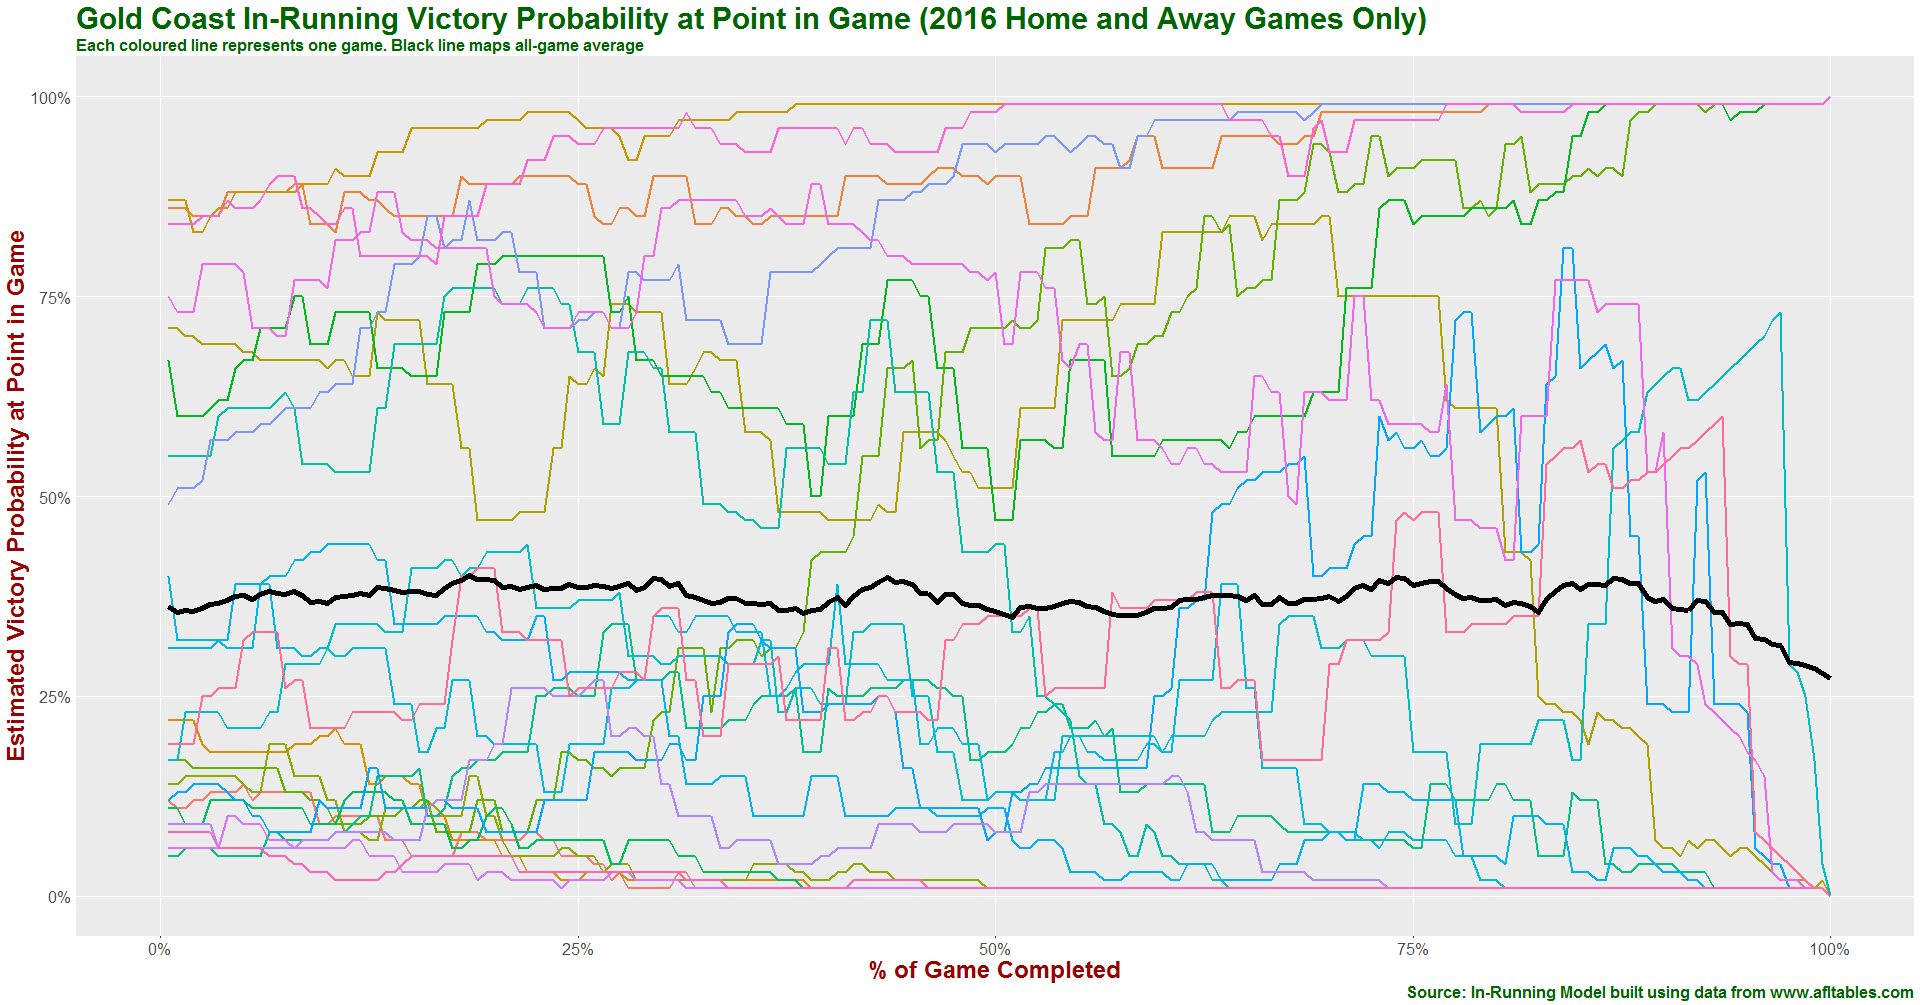
THE IN-RUNNING PROBABILITY FOR EVERY TEAM IN EVERY HOME-AND-AWAY GAME OF 2016
Topic: This chart was created to show the history of every team's estimated in-running victory probability for each home-and-away game of 2016. For each game, 400 estimates are made, 100 within each quarter at equidistant points of elapsed time.
As well as tracking the in-running probability history for each game, an average is calculated for each team at all 400 points, averaged across the 22 home-and-away games. That average is shown as a black line.
Points of Interest
A few things can be determined from these charts:
- Adelaide also generally increased its estimated victory probability as games progressed
- Brisbane Lions were half-time favourites only twice (and won on both occasions)
- Carlton's estimated victory probability tended to fall until about three-quarter time, then rose for the remainder of the game
- Collingwood's estimated victory probability tended to fall away in the second half
- Essendon were half-time favourites in only one game (which they won)
- Fremantle's estimated victory probability tended to decline from about mid-way through the second term
- Geelong's estimated victory probability tended to rise and fall in waves
- Gold Coast's estimated victory probability fell away dramatically in the second half of final terms
- GWS's estimated victory probability tended to grow until about mid-way through the third term, then fell away
- Hawthorn were favourites in the majority of their games at half-time
- The Kangaroo's estimated victory probability tended to fall away slightly in the second half
- Melbourne's estimated victory probability tended to rise in the first half, then fall and rise again before ultimately falling off in the second half of final terms
- Port Adelaide's estimated victory probability, broadly, tended to increase over the course of the first half and then decline in the second
- Richmond's estimated victory probability declined most in the latter parts of third terms and the early parts of fourth terms
- St Kilda's estimated victory probability generally increased as games progressed, though did tend to fall of late in games
- Sydney generally increased its estimated victory probability as games progressed, though they did suffer some late-game losses
- West Coast generally increased its estimated victory probability until about mid-way through third terms, before seeing it decline for most of the remainder. There were though, some late upticks
- Like Geelong's, the Western Bulldogs' estimated victory probability tended to rise and fall in waves
- Hawthorn and the Western Bulldogs were the teams most likely to spring the late upset


