SCORING EVENTS
This page contains charts relating to scoring behaviours in AFL games, using score progression data from the afttables.com website for the period 2008 to 2016.
Time Between Consecutive Scoring Events
In this chart we look at the time between consecutive scoring events, grouping by the type of the previous scoring event and faceting by Quarter.
We see that the time to the next score reduces if the previous score was a behind compared to if it was a goal. That difference reflects the average elapsed time required to get the ball back in play after a behind compared to the time required after a goal (bear in mind that the data we have is from a count-up, not a count-down clock) and also the relative proximity of the ball to a scoring opportunity after the two different score types.
It appears that the differences between quarters are only minimal, but a chart grouping by Quarter and faceting on the previous score type broadly confirms this.

We can add another element to our analysis by grouping not just on the basis of the first score type in the sequence, but also on the basis of the second score type.
Though the differences are small, it appears that behinds appear slightly more quickly after a previous score than do goals. This is shown by the fact that the black distributions tend to be to the left of the green distributions, and the blue distributions to the left of the red distributions.
This phenomenon might partly be explained by the fact that, after a behind, play restarts at the same end of the field as the score was just recorded. This would tend to make the attacking team more likely to score next and score soonest. As such, we might expect to see different distributions for score combinations if we consider consecutive scores for the same team versus consecutive scores by opposite teams.
And, indeed, we see in the distributions that, when the first score is a behind (the bottom two rows), the subsequent score tends to come more quickly if it is the same team scoring. That's reflected in the fact that the red distributions tend to be to the left of the black distributions in these rows.
We can group and facet that data slightly differently to investigate the relationships amongst the distributions for the various scoring sequences, conditioning on Quarter and on whether the same or opposite teams score.
Though again the differences are small, it would seem that, when the same team scores both times:
- behinds follow behinds more rapidly than they do goals (the black distributions are to the left of the green distributions)
- behinds follow goals more rapidly than they do goals (the blue distributions are to the left of the red distributions)
When opposite teams record the scores, we have that:
- behinds and goals follow behinds with about the same time gap (the black distributions and green distributions are similarly located and shaped)
- behinds follow goals more rapidly than they do goals (the blue distributions are to the left of the red distributions)
As Quarters and games progress, conceivably defences might tire which would see consecutive scores being registered more rapidly.
To investigate this, let's look firstly at a comparison within Quarters, splitting each into 25% chunks and charting the time between scoring events in each of those chunks controlling for Quarter and the type of scoring combination.
We see clearly that, for all score type combinations, the gap between the two scores tends to be shorter in the earliest parts of quarters (ie the red distributions tend to be furthest left). There's little difference in the gap size distributions for the other portions of each Quarter. In this sense then, we see little evidence of defences tiring within Quarters. If anything, they might be slightly more vulnerable just after a break.
Next we'll compare the distributions across Quarters, controlling for the score type combination and the portion of the Quarter in which the second score took place.
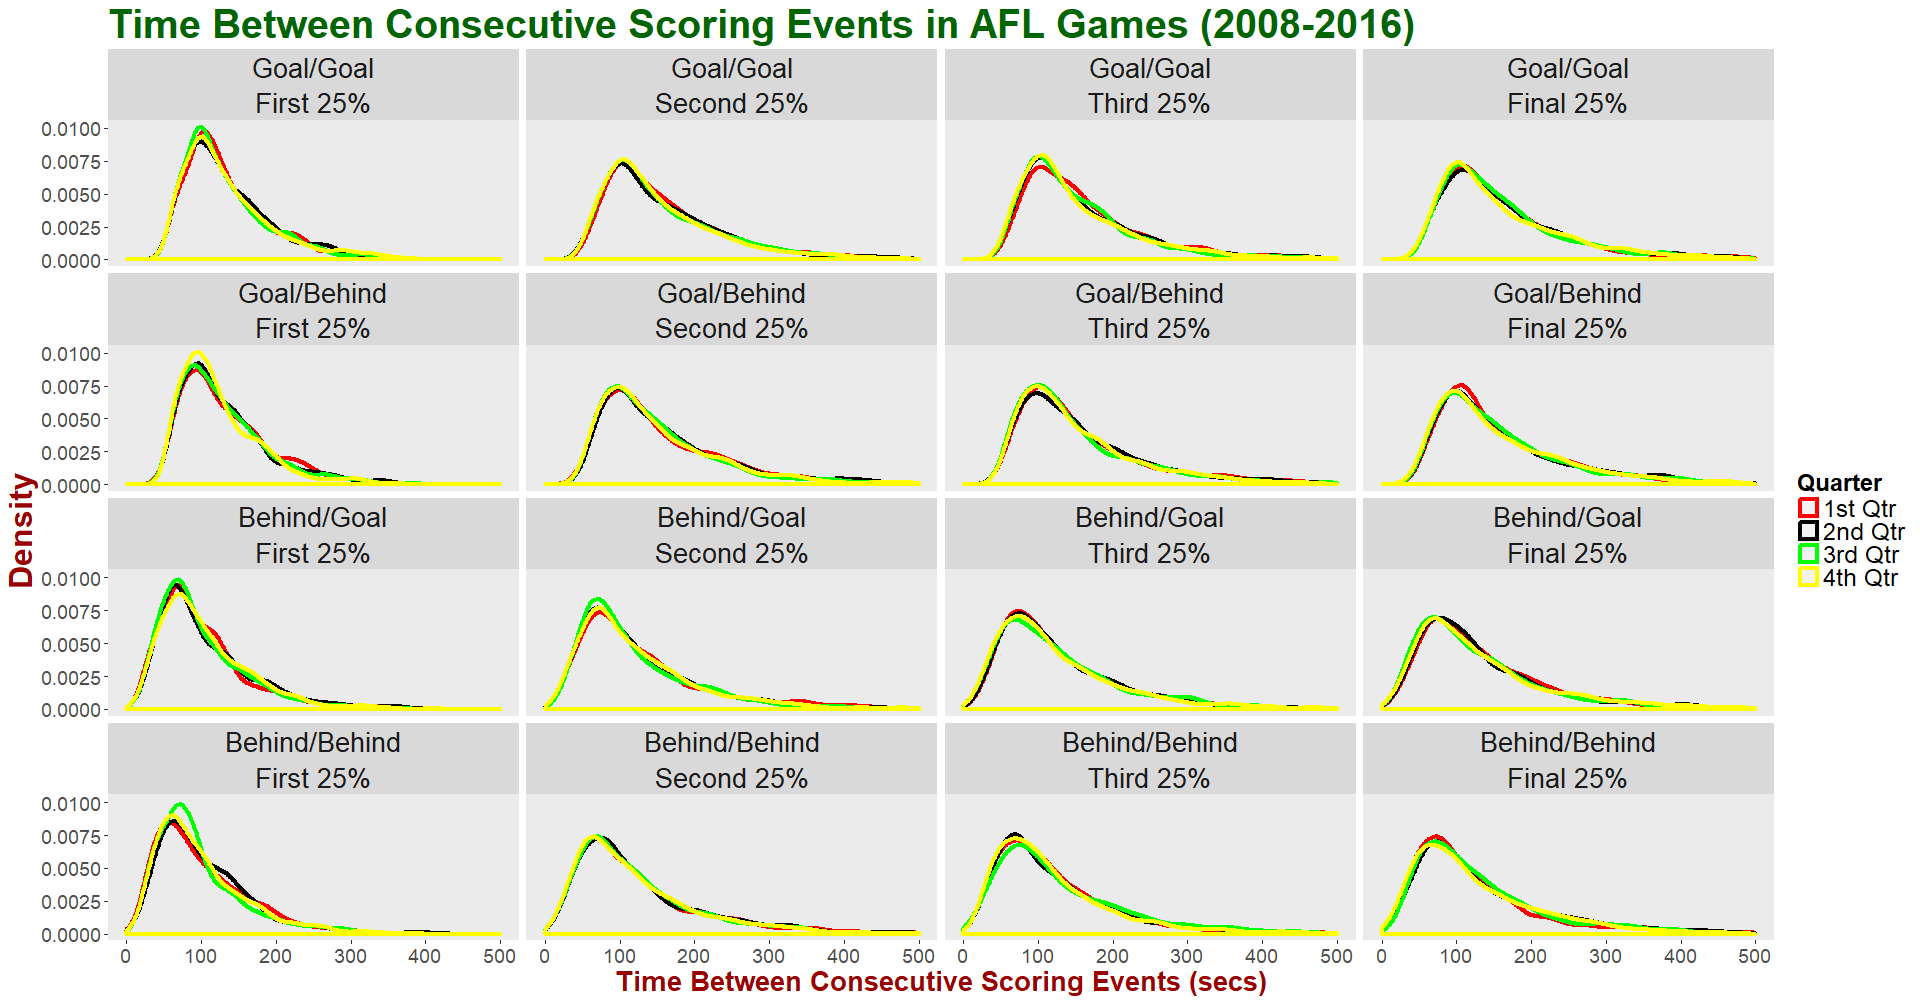
We see virtually no difference in the distributions across all four Quarters.
Another obvious factor that could conceivably alter the cadence of scoring is the current lead.
In this next chart we look at how the distribution of time between consecutive scores differs depending on whether the 1st score left the scorer trailing or not, conditioning on the time in the game at which the second score was registered.
We find that, in Quarter 1 and most of Quarter 2, a score that left a team trailing tends to be followed by another score sooner than a score that left or put a team in front (or drew it level).
Here we've considered lead as a binary variable, but we can also form bins for the current lead based on size.
That's what's been done for the following chart.
Lead appears to have relatively little effect on the time between scores except in the first half of Quarter 1 and the second half of Quarter 4. What we find in those portions is slightly faster scoring in games with smaller or larger leads early in Quarter 1s (ie the black and yellow distributions tend to be left-shifted compared to the green and red distributions), and slightly slower scoring in games with larger leads late in Quarter 4s (ie the black and green distributions tend to be right-shifted compared to the yellow and red distributions). These effects are all quite small, however.
